Momentum Diagrams And Tonnage Ratings. 128. Tonnage Rating
Description
This section is from the "The Economics Of Railroad Construction" book, by Walter Loring Webb, C.E.. Also see Amazon: The Economics Of Railroad Construction.
Momentum Diagrams And Tonnage Ratings. 128. Tonnage Rating
The following demonstration is based very largely on the admirable paper by Mr. A. C. Dennis, M. Am. Soc. C. E., which has been previously referred to. The paper as originally presented is very much condensed, and is not easy to be understood by those who have little or no knowledge of the subject. The statements and numerical illustrations have therefore been amplified in the endeavor to present a somewhat difficult subject in a simple form.
129. Tonnage Rating Of Locomotives
Dennis's experiments indicated that the draw-bar pull of the particular locomotive tested, after being corrected for inertia, grade, and curvature, when drawing a train of empty box cars, averaged about 8.9 pounds per ton. The variation from this figure between the velocities of 7 and 30 miles per hour did not exceed 0.1 pound per ton. On the other hand, the tractive resistance to loaded cars was very uniform at 4.7 pounds per ton when the "tare-weight," or weight of the empty cars, was one-third of the total weight. Since train-loads are made up of loaded, partially loaded, and empty cars, the only practicable method of uniform tonnage rating is to equate live load and tare-weight to a uniform basis of resistance. Since empty cars showed a resistance of 8.9 pounds per ton, and since the resistance per ton was lowered to 4.7 when the cars were loaded with a live load twice the tare-weight, we may write an equation as follows, in which R = the resistance in pounds per ton due to the live load, (R×2/3)+(8.9×1/3) = 4.7, from which we may derive R=2.6. The reasonableness of this view becomes more apparent when we consider that the total tractive resistance consists of the summation of several resistances, some of which (such as atmospheric resistance) are independent of weight, and some of which (such as axle resistance) are decreased per ton by an increase in weight.
According to the above figures, a 50-car train of empties, weighing 15 tons each, would have a tractive resistance of 50x15x8.9=6675 pounds. If each car was loaded with 15 tons, we would have an additional tractive resistance of 50 X15 X2.6 = 1950 pounds, or a total of 8625 pounds. Loading on 15 more tons per car would add another 1950 pounds, making a total of 10,575 pounds. But the total tonnage would then be 2250 and the average resistance would be 4.7 pounds per ton. The tonnage rating is then given by multiplying the tare-weight by a factor such that the "rating ton," as it is called, multiplied by 2.6 will equal the actual tare-weight resistance per ton. But since the grade resistance per ton is a definite quantity, we cannot use the increased hypothetical equivalent in tons in allowing for the actual grade resistance. This factor therefore depends on the rate of grade. For example, on a 0.4% grade the tractive resistance for a "rating ton" is 2.6 pounds; the grade resistance is 8 pounds, the total is 10.6. A ton of tare has a resistance of 9.0 and has a grade resistance of 8.0, or a total of 17. This is 160% of a rating ton. The corresponding figures for other grades are as given in Table XXI. In Fig. 26 is shown the actual tractive power of the locomotive used in Mr. Dennis's tests. The curve of tractive power was obtained by adding to the actual dynamometer pull the grade and rolling resistance of the locomotive and tender. The curve represents average values; the maximum values were about 1000 pounds higher.
Table XXI. Ratio Of Tare Tons To Rating Tons For Various Grades
Grade in per cent. | 0.0 | 0.1 | 0.2 | 0.3 | 0.4 | 0.5 | 0.6 | 0.7 | 0.8 | 0.9 | 1.0 |
Tare ton Rating ton | 346% | 239% | 197% | 174% | 160% | 151% | 144% | 139% | 134% | 131% | 128% |
Grade in per cent. | 1.0 | 1.1 | 1.2 | 1.3 | 1.4 | 1.5 | 1.6 | 1.7 | 1.8 | 1.9 | 2.0 |
Tare ton Rating ton*' | 128% | 126% | 124% | 123% | 121% | 120% | 118% | 117% | 117% | 116% | 115% |
130. Tonnage Rating For A Given Grade And Velocity
We will first compute the tonnage rating for this locomotive on the basis of a velocity of 7 miles per hour and for a 0.4% grade. The tractive power, as obtained from Fig. 26, for this speed is 28,200 pounds. The grade and tractive resistance for a rating ton on this grade is (8.0+2.6) or 10.6 pounds per ton. At 7 miles per hour, the locomotive could therefore handle (28,200/10.6) or 2660 gross rating tons. The actual weight of the locomotive and tender was 130 tons. On a 0.4% grade this is the equivalent of (160% X130) =208 rating tons, which leaves 2452 rating tons behind the tender. The actual load behind the tender will depend on the character of the car loading. Assume first that all cars were empty, then the actual loading would be 2452 /1.60 = 1529 tons. If the live load exactly equaled the tare, we would have for each two tons one ton of live load and (1x1.60) rating tons of tare. The actual tonnage would be = x 2452 =1886
1 + 1.60 tons. If the live load is twice the tare, the actual tonnage would be X 2452 =2043 tons. The above calcula-2 + 1.60 tions are on the basis of 7 miles per hour. If the speed were increased to 25 miles per hour, the tractive power of the locomotive is considerably less. According to Fig. 26 it is only 12,900 pounds. Dividing this as before by 10.6 we have 1217 rating tons. Subtracting the 208 rating tons for the locomotive and tender, we have left 1009 rating tons for the cars. As before, we would have 1009 X [2/(1+1.60)] = 776 tons for half loading, 1009x[3/(2+1.60)] = 842 tons for full loading and 1009+1.60 = 631 tons for empties.
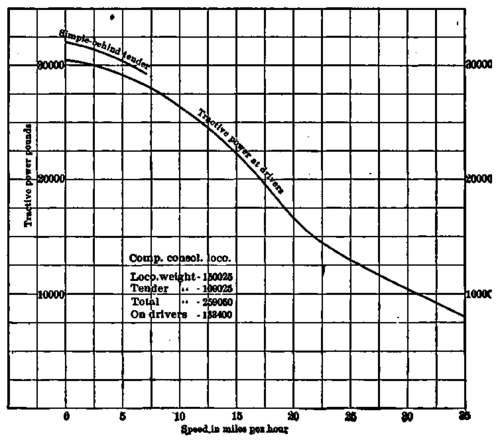
Fig. 26. Locomotive tractive power curve.
A tabulation of the above values will more clearly indicate the comparative effect of grades and loading. It is assumed that "full load" means a live load of double the weight of the car.
Velocity of train. | Cars empty. | Half loaded. | Fully loaded. |
7 miles per hour ............................... | 1529 | 1886 | 2043 |
25 " " " ............... | 631 | 776 | 842 |
The reduction in the capacity of the locomotive at the higher speed is not due to the extra resistance, but to the inability of the locomotive to develop the requisite power at the higher rate.
Continue to:
My Books

