Meteorology
Description
This section is from "The American Cyclopaedia", by George Ripley And Charles A. Dana. Also available from Amazon: The New American Cyclopædia. 16 volumes complete..
Meteorology
Meteorology (Gr.![]() , lofty, and
, lofty, and![]()
![]() discourse), the description and explanation of the phenomena peculiar to the atmosphere of the earth. On the atmosphere and its changes depend the development of life, both vegetable and animal, the currents and the navigation of the ocean, and even the great changes that have been wrought in geological ages by superficial disintegration and erosion. The consideration of these and kindred subjects gives rise to branches of science that may be considered as applications of meteorology proper, which should be restricted to the simple consideration of the atmospheric phenomena themselves, and the laws which produce them. As a science of observation, generalization, and induction, our present knowledge of meteorology dates from Aristotle; but as a deductive science, and one deserving to be ranked with astronomy, chemistry, and physics, its history is confined to the past 25 years. In this article we shall present in brief some of the more important general statistics, thus representing the results of the observations by which deductive theories must be tested, and shall conclude with a few words on the latter. - Inductive Meteorology. Our review of the inductive science will be divided into sections on the constitution, the temperature, the movement, the moisture, and the pressure of the atmosphere, in which arrangement we follow the very valuable treatise of Schmid.
discourse), the description and explanation of the phenomena peculiar to the atmosphere of the earth. On the atmosphere and its changes depend the development of life, both vegetable and animal, the currents and the navigation of the ocean, and even the great changes that have been wrought in geological ages by superficial disintegration and erosion. The consideration of these and kindred subjects gives rise to branches of science that may be considered as applications of meteorology proper, which should be restricted to the simple consideration of the atmospheric phenomena themselves, and the laws which produce them. As a science of observation, generalization, and induction, our present knowledge of meteorology dates from Aristotle; but as a deductive science, and one deserving to be ranked with astronomy, chemistry, and physics, its history is confined to the past 25 years. In this article we shall present in brief some of the more important general statistics, thus representing the results of the observations by which deductive theories must be tested, and shall conclude with a few words on the latter. - Inductive Meteorology. Our review of the inductive science will be divided into sections on the constitution, the temperature, the movement, the moisture, and the pressure of the atmosphere, in which arrangement we follow the very valuable treatise of Schmid.
1. Constitution And Properties Of Air
To Priestley and Scheele (1774) we are indebted for our first knowledge of the chemical constitution of the atmosphere as a mixture of oxygen and nitrogen; to these constituents Bergman in the same year added carbonic acid gas as the third component; of the other gases that are present in very small quantities, excepting the vapor of water, it is not necessary to make further mention. The proportions by weight of the previously mentioned gases in the air over the Atlantic ocean are very nearly as follows: nitrogen, 77 per cent.; oxygen, 23 per cent.; carbonic acid gas, 1/20 of 1 per cent. The weight of one litre (61 '027 cubic inches) of air, at 32° F., and a barometric pressure of 29-9 inches, is 1.293187 grammes (19.9569 grains), as determined by Kegnault (1847). A unit's volume of dry air at the temperature of 32°, if free to expand, increases to 1.3665 on being heated to the temperature of 212°. The increased pressure experienced on heating from 32° to 212° a volume of dry air confined within the same space is in the ratio of 1 to 1.36706. The specific heat of air is usually assumed as unity, and the increase of temperature due to a sudden condensation of any portion of it into a smaller volume is about 10° for a diminution in volume of 1/30 assuming that the air originally is at a temperature of 32° and a pressure of 30 inches.
The coefficient of viscosity of air is, according to Maxwell (1872), in British measures, 0.0825 at temperature 32 . The altitude and figure of the atmosphere are terms to which, strictly speaking, no exact definition can be given, since it is not yet certain that the rarefied gases in its upper portion do not merge by insensible degrees in the ether of interstellar space. On the other hand, the only portions of the atmosphere that have any important bearing upon meteorological phenomena are those below which the phenomena of twilight, the aurora, and shooting stars take place, and these are generally confined to an altitude less than 100 m. above the earth's surface. At an altitude of 29 m. the air has a density one tenth of that which it has at the surface of the earth; that is, at that altitude the average barometric pressure would be three inches, and it is not likely that any changes take place at this height that are appreciable at the surface of the earth. The elevations of the mountains on the earth's surface bear a very appreciable ratio to the altitudes of the cloud-bearing and storm-producing strata of the air; in fact, these latter nearly all lie far below the summits of the highest ranges; and, as a consequence, the distribution of the elevated portions of the continents is a very important factor in meteorology.
Of equal or even more importance is the relative position of the land and oceans. Not only is the ocean the principal source of the moisture in the atmosphere, but its influence is felt in a very different way. The power of absorbing and radiating solar heat is very great for all vegetable structures, such as the forests and prairies present; solid earth and rocks possess these properties in a far less degree, and even lower than these in the scale must be placed the ocean water. On the other hand, the specific heat of the earth is so much less than that of water, that the same amount of heat received from the sun upon each will affect the temperature of the air over the land nearly twice as much as that over the ocean.
2. Temperature
Atmospheric temperatures are almost uniformly measured by means of the mercurial or the spirit thermometers, the air thermometers being at present employed only in researches of extreme delicacy. (See Thermometer.) The heat found within our atmosphere may be considered as coming from six sources: 1, that peculiar to the interior of the earth; 2, that received from the stars; 3, that received from the moon; 4, that received from shooting stars; 5, that produced by friction of tides, winds, etc.; 6, that received from the sun; all which should be added to that originally possessed by the atmosphere. Considering the original heat as tending continually to be radiated and lost in space, the true meteorological problem is to determine how this loss is made up from the six sources just enumerated. 1. That the interior of the earth is in general warmer than the surface is shown by observations of temperature in deep springs, wells of water, and mines, and by the phenomena of volcanoes and geysers, and is very plausibly demonstrated by all seismological theories. (See Earthquake.) As an average for the whole earth, and especially applicable to the temperate zone, the temperature at a depth of 80 to 100 ft. is constant, showing that at this point we reach the surface of equilibrium between the conduction of heat from the interior outward, and the effect of the radiation from the earth's surface.
The only known exception to this rule is found in the northern portion of Siberia, where at a depth of 400 ft. the temperature is still 10° below the freezing point. On account of the slow conducting [tower of tin-materials of the earth, the superficial layer of 80 ft. in thickness should be viewed by the meteorologist not as a medium through which any important part of the interior heat of the earth is conducted to the atmosphere, but rather as a storehouse of the solar heat that enters into the ground, and thus equalizes the daily and annual changes of temperature. Nevertheless, the quantity of heat conveyed into the atmosphere by the circulation of air within mines, by hot springs, and by volcanoes, is perhaps barely appreciable, and is for the entire globe possibly equivalent to an elevation of 1/100° F. in the temperature of the entire atmosphere. 2. Since the earth is in the centre of a celestial vault thickly studded with stars, each of which radiates heat in all directions, its tendency is to assume a temperature higher than that which prevails throughout the interstellar spaces; the latter being estimated by Pouillet at about - 222° F., while the temperature of the earth due to the stellar heat would be - 128° F. 3. The heat radiated from the moon to the earth, though exceedingly small, has been measured by Lord Rosse (" Philosophical Transactions," 1873). The greater part of this heat is absorbed by the aqueous vapor of the atmosphere before it can reach the earth's surface.
The principal effect of the lunar heat is therefore probably exerted in warming the upper layers of air, and in dissipating the clouds. The surface of the moon as heated by the sun attains to its maximum temperature a few days after the full moon, at which time its influence on the clouds and on the rainfall is probably barely appreciable at stations favorably situated, though Klein (1868) and Wierzbicki (1873) have shown it to be inappreciable in the interior of Europe. 4. The numerous shooting stars that daily enter the earth's atmosphere bring into it an appreciable quantity of heat, as is evident by their own combustion and dissipation; but as yet no accurate knowledge on this point is available. This heat is a simple case of the conversion of force into heat, and its amount could be calculated had wo any positive information as to the mass of the meteors. 5. A small fraction of the energy of the earth's daily rotation is by friction converted into heat, which passes from the ocean to the atmosphere and exerts a slight warming influence. For the further consideration of this obscure subject, see Fer-rel, "Tidal Researches" (Washington, 1874). 6. Solar radiation produces on the earth both chemical and optical as well as thermal effects.
This is subject to very slight fluctuations, connected in some unknown way with the variations of the solar spots; the frequency and extent of the latter vary in a period of 11 1/9 years, and possibly also in a period of 55 or 56 years.
Attempts have been made to demonstrate other periods, of which perhaps the only one whose existence is plausible appears to agree with the time of rotation of the sun upon its axis. We are therefore justified in considering the intrinsic radiation from the sun as very approximately constant, and the diurnal and annual variations of terrestrial temperature depend upon the position of the station on the earth's surface, and the position of the earth's axis of rotation in reference to the annual orbit described by the earth about the sun. The quantity of heat received by any surface varies directly as the time of exposure and as the sine of the sun's altitude, and inversely as the square of the sun's distance. According to Lambert (1770) and Meech (1855), the sun's daily intensity is proportional to the cosine of the latitude. At either pole the intensity in midsummer is one fourth greater than on the equator; this arises from the fact that daylight on the equator lasts but 12 hours, "while at the pole the sun shines throughout the whole 24 hours. In general, from May 10 to Aug. 3 the sun's vertical intensity over the north pole is greater than upon the equator.
In the temperate zone the temperature of the air attains its maximum about one month after the maximum of the sun's intensity; in this interval therefore the earth must receive during the day more heat than it loses by radiation at night. The average annual intensity upon the whole earth's surface from pole to pole is 200 thermal days, the intensity of each of which units equals that of the mean equatorial day. The annual intensity of solar rays during 100,000 years, past or future, can never vary (owing to the varying eccentricity of the earth's orbit) more than the equivalent of live hours of average sunshine in a year. These conclusions refer to the whole earth's surface collectively. On the other hand, the annual intensity at the different latitudes on the earth varies much more considerably, and the extreme values of diurnal intensity may vary by as much as one ninth of the present value. It seems therefore that under the existing conditions of physical astronomy the intensity of solar heat upon the earth can never have been materially different from its present value. - in these rules we have considered only the heat, received at the outer surface of the atmosphere from the sun, neglecting the absorption of heat by the earth's atmosphere and the radiation of heat back into space, two circumstances that materially affect actual temperatures.
The absorption of lc-at in its passage through the atmosphere is directly found approximately by observations made with the pyrheliometer of Pouillet (Pog-gendorff.s Annalen, xlv.), or the actinometer of Herschel (1825), which instruments replace the ruder contrivances of earlier days, such as Leslie's photometer (1707), and De Saussure's helio-thermometer (1787). The only self-recording apparatus that indicates the power of the direct rays of the sun at present in use is the so-called black-bulb-in-vacuum or solar-radiation thermometer of Negretti and Zam-bra. Observations with Pouillet's pyrheliometer show that the absorption of solar heat by the atmosphere follows sensibly the same law as the absorption of solar light, and amounts for the temperate zone to from 20 to 40 per cent, when the rays penetrate vertically downward. According to the investigations of Melloni, Tyndall, Magnus, and others, aqueous vapor is almost opaque to the invisible heat rays belonging to the red end of the spectrum, and accordingly an increase in the absorption of the direct solar rays occurs where an increased amount of moisture is present in the air.
The absorption of solar heat by the material composing the earth's surface varies of course with every change in the constitution or mo-lecular condition of the latter. Dry and sandy or rocky soils become heated to a higher temperature than the moister portions of the earth, while the ocean experiences the least variation of temperature. But perhaps the most important property of the earth's surface consists in this, that the rays which are not absorbed by it, and which are consequently radiated back through the atmosphere, have been degraded to the red end of the spectrum; these are therefore very largely absorbed by the aqueous vapor in the lowest portions of the atmosphere, from 40 to 90 per cent., according to the dryness of the air, being retained within one or two miles of the earth's surface. As a consequence of this absorption, the temperature of the air at the surface rises most rapidly during the day at places covered by a layer of clear moist air, even though such layer be at a considerable altitude above the station, without reaching down to it; and on the other hand, the temperature diminishes most rapidly at night when a clear atmosphere, holding but little moisture, exists over the station.
The conduction and convection into the interior of the earth and ocean of the solar heat that falls upon its surface, produces such a storing up of heat as to sensibly ameliorate the sudden changes that would otherwise occur, and to delay the periodical daily and annual maxima and minima of atmospheric temperature. The temperature of the soil has been measured by means of thermometers whose bulbs are, as was first suggested by Quetelet, permanently imbedded therein; and the general laws governing the distribution of temperature in the interior of the earth were mathematically investigated by Fourier (1812) and Poisson (1835). The range of the variations of temperature diminishes rapidly as we descend into the soil, forming an inverse geometrical series when the depths form an arithmetical series; again, the durations of corresponding periodical changes in temperature at and below the surface of the ground increase at any depth in proportion to the square root of the durations of the surface periods. Daily variations of temperature are perceptible at a depth of 3 ft., while annual variations are barely observable at a depth of 80 ft.
The effect of the sun's heat upon the water of the ocean differs in some important respects from its effect on the continents: first, in that a large percentage of heat is rendered latent in evaporating the surface water of the ocean; secondly, in that the specific heat is much larger for water than for dry earth; and finally, in that the mobility of the water permits of a very extensive system of convection. According to the observations of Lenz (1829), Carpenter (1870), Thomson (1874), etc, the average temperature of the ocean at depths greater than 500 ft. is that of the maximum density of water at the pressure to which it is subjected. The temperature of a layer a few inches in thickness on the immediate surface of the water can, when the ocean is very still, be raised as high as 90° F.; but in the general disturbed condition of the water its surface temperature is much below that of the adjacent stratum of air. As a secondary effect of the influence of the ocean, must be noted the fact that the heat rendered latent in the evaporation of its surface water in great part returns to the atmosphere when that vapor is condensed to cloud and rain. - Having thus indicated the original sources of atmospheric temperature, we come to the consideration of that subject itself.
In order that the temperatures measured in different portions of the world may be comparable among themselves, it is necessary that uniformity should be secured in the exposure of the thermometer to such influences as can affect its indications. As a general rule, in ascertaining the temperature of the lowest stratum of air, the thermometer should be elevated not less than 5 nor more than 50 ft. above the earth's surface, and should be surrounded on all sides, at a distance of from 1 to 5 ft., by a light double latticework, or equivalent structure, which can itself rapidly follow the varying temperature of the air, and prevent all radiation of heat except that which takes place between the thermometer and the interior of the latticework. But such a thermometer cage is scarcely practicable in the investigations of the temperature of the upper strata, so far as they can be reached by aeronauts, and numerous but unsatisfactory studies have been made into the relations between the indications of protected and unprotected thermometers. Some knowledge as to the temperature of the upper strata is given by the study of the refraction by the atmosphere of the rays of light which reach us from the celestial bodies.
The most important features of atmospheric temperature are its variation with the altitude, its diurnal variation, its annual variation, and its geographical distribution. On the three latter points the mass of information can best be presented by graphic methods, as in the accompanying diagrams. But the irregularities of the temperatures at various altitudes may be better seen by the study of the following table:
As Shown By Observations In Balloons Diminution Of Temperature With Increasing Altitude
ALTITUDE | Gay-Litssac and Biot. | Welsh and Green. | Glaisher and Coxwell. | |||||
1804, Sept. 16 | 1852, Nov. Id | 1862, July 17. | 1862, Sept. 5. | 1863, April 18 | ||||
Feet. | Asc. | Desc | Asr. | Desc. | Asc. | Desc. | ||
0,000 | 87.4° | 50.0° | 59o0' | .. | 59.5° | .. | 61o0' | 570° |
1,000 | .. | 46.2 | .. | .. | 56o0' | . | 59.2 | .. |
2.000 | .. | 42.4 | .. | .. | .. | 54.0° | 57.0 | .. |
3,000 | .. | 88.7 | . | .. | .. | 53 5 | 51.0 | .. |
4,000 | ... | 36.5 | 45 0 | .. | 45.0 | ... | 48.2 | ... |
5,000 | .. | 35.8 | .. | .. | 41.0 | 49.2 | 44.2 | .. |
0.000 | .. | 34.9 | 35.8 | .. | 36.5 | 45.5 | 401 | .. |
7,000 | .. | 34.0 | .. | 40.0 | 41.0 | 85.9 | .. | |
8,000 | .. | 32.4 | 82.5 | .. | . | 40.0 | .. | .... |
9,000 | .. | 81.1 | .. | .. | .. | .. | .. | .. |
10,000 | 54.4 | 28.6 | 20 .0 | 37.4 | 32.0 | 31.5 | 32.0 | 25.0 |
11.000 | 52.0 | 25.5 | 31.2 | 31.0 | .. | 21.0 | ||
12.000 | 47.5 | 22.1 | 26.0 | 342 | ...... | 20.5 | 31.0 | .. |
18.000 | 50.1 | 17.8 | 29.0 | .. | 26.0 | 24.5 | 23.0 | .. |
14.000 | 48.8 | 15.8 | .. | .. | .. | 23.0 | 21.0 | 16.5 |
15,000 | 47.6 | 14.2 | 330 | 18.0 | 20.0 | 170 | ||
16,000 | 43.8 | 12.9 | 81.0 | 29.7 | 16.5 | 18.0 | 17.5 | 16.0 |
17.000 | 36.8 | 9.7 | 33.0 | .. | .. | .. | 12.0 | .. |
18,000 | 36.9 | 5.4 | .. | .. | 15.0 | .. | .. | .. |
19,000 | 30.9 | 2.8 | 85.0 | 15.0 | .. | 12.0 | .. | |
20.000 | 29.2 | -1.8 | 31.5 | .... | 8.0 | 17.0 | 10.5 | .. |
21,000 | 23.8 | 6.2 | 24.5 | 110 | .. | 13.0 | 14.5 | |
'22.000 | 20.9 | 9.2 | 19.2 | 28.0 | 45 | 11.0 | 16.5 | .. |
23,000 | 14.5 | 10.8 | 20 | 12.5 | 125 | |||
24,000 | .. | .. | 16.5 | 27.0 | 0.0 | 12.0 | 120 | |
25.000 | .. | .. | 16.0 | 19.0 | - 2.0 | - 2.0 | ... | .. |
26,000 | .. | .. | 10.0 | .. | 5.0 | .. | .. | .. |
.... | .. | .. | .. | ... | .. | .. | .... | .. |
37,000 | .. | .. | .. | .. | 11.9 | 11.9 | .. | 4 |
The decrease of temperature with increase of elevation has apparently a diurnal and an annual change, and 30 ascensions in 1868 showed that it may very probably often during the night be reversed into an increase instead of decrease, at least for the lowest 2,000 ft. Above the clouds the temperature decreases very steadily. As an average of all of his midday ascensions, Glaisher says that the diminution in the first 1,000 ft. was 4.5° with a cloudy sky, and 6"2° with a clear sky. In an ascent made on April 6, 1864, remarkable variations were met with, such that at 10,000 ft. the thermometer registered the same as on the earth's surface; but on this occasion clouds and fogs alternated up to the highest point at-tainedby the balloon. - Diagram No. I. shows the diurnal variations of temperature for January and July, as deduced from observations continued through several years at stations in different geographical positions. In this table the average daily temperature of the month is assumed as the zero line. The annual variations for a few representative stations are shown graphically in diagram No. II., where even the minuter features of the yearly changes are developed by the use of Dove's five-day means.
It will be noted that the maximum temperature occurs at Madras at the time of the solstice, while at stations further north it occurs two to five weeks later. Diagrams No. III. and IV. give the average distribution of mean temperatures over the surface of the earth as shown by means of the isothermal lines for January and July respectively, as published for January; full lines for July by the British admiralty in 1872. These lines depend on the immense mass of observations collected by that hoard, and by the labors of Dove, Maury, Buchan, and many others. The comparison of the isothermals for January and July shows at a glance the results of the combined influence of the solar altitude, the distribution of continents, plateaus, oceans, etc. The more detailed analysis and comparison of these temperatures belongs to the subject of climatology. So far as our observations extend, they show that the annual mean temperatures of the points having the same latitude are about 2 1/2° higher in the northern than in the southern hemisphere.
The average temperature of the whole earth, according to Dove, is greater in July than in January by about 8° F., although in July the earth is further from the sun than in January, in the ratio of 93 to 90. Besides the preceding normal and periodical fluctuations of temperature, as deduced from the average of many observations, the temperature of the air is subject to large non-periodic variations, which disturbances, properly so called, are considered in connection with Storms, under that title. The more important of these non-periodic variations accompany the areas of moist and dry air, as these successively flow over the earth's surface. These disturbances in the periodical variation of temperature have their origin in terrestrial influences, and are the secondary reaction of the sun's rays themselves.
3. Winds And Currents
If we neglect the slight amount of heat received from other sources, we may in general say that the winds are due to the combined influences of the rotation of the earth on its axis and the disturbances of the air, caused either by the introduction and subsequent condensation of its vapor, or simply by the warming of the lower strata of the atmosphere by the sun. The movement of the air is therefore a question of mechanics, capable of solution in just so far as mathematical analysis is able to fully take into account the combined influence of these primary forces, and the laws of pneumatics, friction, etc. This subject has been inductively investigated by Ooifln, Buchan, Muhry, and Hann. The observations of the lower strata of the air are best obtained, as regards the directions of movement, by the self-recording wind vane, and as regards their velocity, by the self-recording anemometers. Apparatus by which these two anemometric elements are recorded continuously has in some form or other been adopted during the past few years by the government observers at a large number of stations throughout the world.
The measurement of the pressure exerted against a flat surface by the wind is sometimes substituted for the direct measurement of the wind's velocity; but these two elements are only with difficulty and approximately to be compared between themselves. When observers have no means of measuring force or velocity, an empirical scale is adopted, two forms of which are in common use, that of Admiral Beaufort and that of the Smithsonian institution; these are given in the following table. Owing to the great differences in the estimates of wind force, it is difficult to convert these einnirieal scales into actual wind velocities, and they should be discarded whenever a good anemometer is available.

Diagram I -Diurnal Variation of Temperature.

Diagram II. - Annual Variations of Temperature.

Diagram III. - Isotherms or Linus of Equal Temperature lor January.

Diagram IV. - Isotherms or Lines of Equal Temperature for July,.
Empirical Scale Of Winds
BEAUFORT SCALE. | ||||
Number. | Designation. | Description. | ||
0 ..... | Calm............ | .... | ||
1........ | Light air ........ | Just sufficient to make steerage way. | ||
2.. | Light breeze .... | With which a ship with all sails set would go in smooth | 1 to 2 knots. | |
3.. | Gentle breeze... | 3 to 4 " | ||
4......... | Moderate breeze | 5 to 6 " | ||
5>.. | Fresh breeze.... | In which she could just curry | royals. etc. single reefs and topgallant sails. double reefs and jib, etc. triple reel's, etc. close reefs and courses. | |
6......... | Strong breeze... | |||
7......... | Moderate pale... | |||
8. . | Fresh gale...... | |||
9........ | Strong pale..... | |||
10......... | Whole gale...... | In which she could just bear close-reeled main topsail, and reefed foresail. | ||
11......... | Storm ......... | ruder storm staysails or trysails. | ||
12........ | Hurricane...... | Under bare poles. | ||
SMITHSONIAN SCALE. | |
Number. | Designation. |
0......... | Calm. |
1......... | Very light breeze. |
2......... | Gentle breeze. |
3......... | fresh wind. |
4......... | Strong wind. |
5......... | High wind. |
6......... | Gale. |
7.......... | Strong gale. |
8......... | Violent gale. |
9......... | Hurricane. |
10........ | Most violent hurricane. |
The movements of the upper currents of the atmosphere have been observed by means of the clouds, balloons, the transfer of volcanic ashes, and the occasional luminous trains that are left in the wake of bright meteors. These latter, being from 10 to 100 m. above the earth's surface, have given us the only knowledge we have attained with respect to the currents at so great an elevation. With regard to the ascending and descending currents of air, no satisfactory method of observation has yet been put into execution, though such seems practicable by an aeronaut. So far as our present information justifies an opinion, it seems probable that at an altitude of above 10 m. the atmospheric currents are subject to variations as large, though perhaps not as sudden, as are the winds at the surface. In the lower portion of the atmosphere it is not uncommon to find two or three currents of air, from as many different directions, superimposed upon each other. (See Storms.) - The general phenomena of the winds at the surface of the earth may be considered in reference to their diurnal and annual variations, and their geographical distribution.
The daily period in the strength and velocity of the wind is due in great part to the unequal heating of the different portions of the land, and especially to the over-heating of the land as compared with the sea. This period is most strikingly manifested at the stations on the immediate coasts of continents, and on the borders between mountainous countries and plains. In the latter case the elevated regions of the earth are cooled by nightly radiation, and the cold layers of dry air in contact therewith subsequently flow down and slip under the warmer and moister air of the lower lands. An excellent, instance of the mutual influence of ocean and continents on the daily variations of the wind is shown in the accompanying diagram, V., which gives the direction of the winds each hour of the day, for the months of January, May, and July, at Wallingford, near New Haven, Conn., as published by F. E. Loomis in 1871. In this figure the arrows show the direction toward which the wind moves; the respective monthly lines show by the changes in their directions, at every point from feather to barb, the changes of the wind from hour to hour.
It will be seen, in fact, that in May the early morning winds are northerly (land breezes), while the evening winds are southerly (sea breezes). A daily period in the force with which the wind blows is as conspicuous as the periodicity in its direction. This is well exemplified in diagram VI., from Loomis, showing the average pressure of the wind in pounds per square foot for each hour, derived from the observations of Bache at Philadelphia. - The annual variations of the wind may be traced back to the same ultimate cause, namely, the varying influence of the unequally heated portions of the continents and oceans. The most remarkable annual variations in the winds are those known as monsoons, in the Indian ocean. The most remarkable permanent or nearly permanent winds are the trade winds, which flow from the northeast and southeast, in the northern and southern hemispheres respectively, toward the equator, and include between them a narrow belt of equatorial calms. The latter has a breadth of a few degrees only, and varies its position with the seasons, lying somewhat further to the north of its mean position in July, and to the ith in January. On account of the intimate relation between the direction of the wind and the barometric pressure, it is best to represent these two meteorological elements on one map; and accordingly on the accompanying charts, Nos. VII. and VIII. (compiled from those published by the British admiralty in 1872), are shown by arrows flying with the wind the prevailing winds for the months of July and January, over the entire globe; regions of prevailing calms are designated by shaded circles.
The comparison of these charts will show more clearly than words the great changes which take place in the movements of the air during the year. The principal regions of ealnis and light variable winds, besides the equatorial belt already mentioned, are those belts about 10° broad, lying X. and S. of the trade wind regions, in the respective hemispheres. Coffin (1853) has moreover shown that N. of the belt of calms in the Atlantic the winds both of Europe and America show comparatively slight but decided indications of monsoon features, due to the over-heating of the laud in summer and its cooling in winter. Similar phenomena are observed in reference to the Sahara of northern Africa, and to the continent of Australia. Of the non-periodic variations of wind, the most important are those attending storms. Dove has shown that, at any station in the northern temperate zone, the wind veers more frequently than it back-: that is to say, the successive wind changes are more frequently in the order S., W., N., etc., than they are in the reverse order, S.. E., N., etc. Hut this interesting law may be considered as a simple consequence of the position of the stations in relation to the paths generally pursued by storm centres.
Red-lield (1821 -'57) was the first to prove that in all extensive severe storms there is always present a system of surface winds revolving about and blowing in toward a storm centre, which latter has a progressive motion along the surface of the earth. At a short distance above the earth's surface is a system of outward-moving spiral currents immediately above the lower inward-moving winds. The independent investigations of Espy (1837), Reid, Piddington, Lev, and others, have abundantly confirmed the correctness of Kedfield's conclusions; and the studies of later writers have shown that such a system of winds is characteristic of severe storms throughout the world. (See Hurricane, And Storms.) The relation between the wind and temperature is graphically represented by the thermal wind rose, which gives for each direction of the wind the average temperature remaining after eliminating the effects of the daily and annual changes and the lesser local peculiarities. The following table presents a few of the stations for which sufficiently long periods of observation are available to render the average results trustworthy:

Diagram V. - Diurnal Change in the Direction of the Wind at Wallingford, Conn.
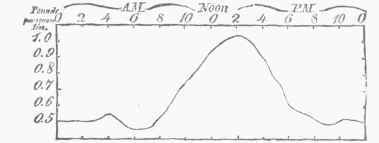
Diagram VI. - Diurnal Variations in Force of Wind at Philadelphia.
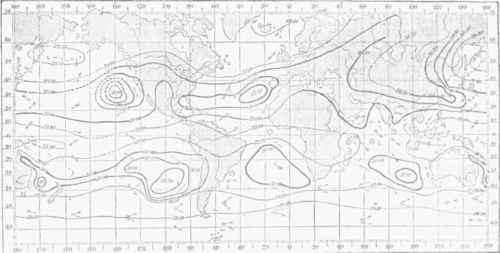
Diagram VII. - Isobars and Prevailing Winds for January. February, and March.
Shaded circles indicate regions of numerous calms.
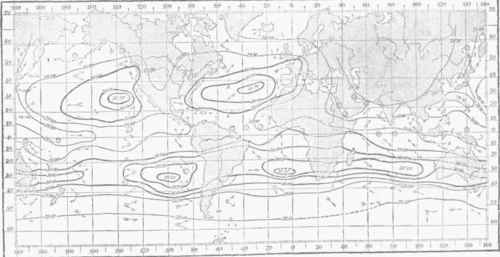
Diagram VIII. - Isobars and Prevailing Winds for July, August, and September.
Shaded circles indicate regions of numerous calms.
Thermal Wind Rose
WIND. | NEW HAVEN. | ST. PETERSBURG. | |||||
Year. | Jan. | July. | Jan. | July. | Jan. | July. | |
N...... | 46.3° | 26.6° | 66.3° | 32.4° | 61.0° | 13..8° | 58.6 |
N. E.... | 48.4 | 26.4 | 70.2 | 30.3 | 61.6 | 7.1 | 627 |
E...... | 49 .5 | 25.5 | 74.3 | 81.6 | 65.0 | 13.8 | 64.7 |
S.E..... | 50.2 | 20.3 | 71.8 | 35.6 | 66.8 | 10.7 | 65.5 |
S....... | 52.2 | 30.7 | 72.5 | 40.4 | 65.4 | 13.6 | 65.4 |
s. w.... | 53.0 | 35.4 | 72.5 | 39.8 | 63.7 | 19.7 | 64.9 |
w...... | 47.9 | 36.0 | 65.9 | 36.8 | 63.6 | 19.0 | 61.6 |
N.W... | 44.5 | 32.0 | 66.0 | 33.3 | 62.0 | 13.1 | 60.2 |
N | 46.3 | 26.0 | 66.3 | 32.4 | 61.0 | 13.8 | 58.6 |
The connection between the direction of the wind and the position of the moon in its orbit has been investigated by Schubler and Eisen-lohr for stations in Germany, and the results, as shown in the following table by Schubler, would indicate that N. and E. winds are more frequent at the time of the last quarter of the moon, and that S. and W. winds prevail at the second octant:
Table Shoving The Prevalence Of Each Wind On The Days Of The Respective Phases Of The Moon
LUNAR PHASES. | N. | N. E. | E. | S. E. | S. | S. W. | W. | N. W. | Mean direction. |
New moon... | 6 | 18 | 44 | 13 | 17 | 28 | 45 | 28 | S. S. w. |
First quarter... | 8 | 12 | 40 | 17 | 17 | 24 | 55 | 24 | S. W. by W. |
Second octant.......... | 7 | 16 | 33 | 18 | 12 | 23 | 62 | 22 | W. by S. |
Full moon............. | 11 | 15 | 35 | 16 | 12 | 25 | 50 | 23 | W. |
Last quater... | 12 | 29 | 41 | 10 | 13 | 35 | 3S | 18 | w. |
4. The Aqueous Vapor, whose presence in the atmosphere is of the highest importance in a meteorological point of view, as well as in reference to animal and vegetable life, may here be considered as having its ultimate origin in the ocean, whence it is drawn by surface evaporation under the influence of solar heat. Its subsequent diffusion throughout the atmosphere is in a slight degree due to Dalton's principle of the diffusion of gases, but principally to its convection by the winds; its deposition, whether in the form of clouds or rain, is the result of the subsequent cooling of the moist air. Of the rain which falls upon the land, a large portion is again evaporated, and thus returned to the atmosphere, and ultimately to the ocean. The quantity of moisture in the air is determined for meteorological purposes by means of observations with either the hair hygrometer of De Saussure, the wet and dry bulb thermometers of August, or the dew-point instruments of Daniell, Regnault, Bache, and others. (See Hygrometry.) Measurements of evaporation have such a peculiarly local significance that it has been difficult to ascertain any practicable means of making these comparable with each other; but it may be said with considerable certainty that evaporation is two or three times greater in sunshine than in shade; is four or five times greater in hot summer days than in cold winter days; is greater in windy weather in proportion to the strength of the wind; is greater in dry than in moist weather; greater from marshes and forests than from fields of melting snow; greater from the latter than from the surface of the ocean; and in general greater in the equatorial than in the temperate regions.
The aqueous vapor in the atmosphere may be considered from several points of view, namely: as to the pressure it exerts in maintaining barometric equilibrium; or as to its absolute quantity; or, again, as to its relative quantity as compared with the amount required to saturate the atmosphere. The condensation of a portion of the vapor into cloud or rain, on the one hand, diminishes the barometric pressure, thereby giving rise to local areas of low barometer and on the other hand, by leaving the remain-ing air dryer, allows a more perfect radiation into space of the terrestrial heat, thereby increasing the diurnal variations of temperature. The diurnal variation in the expansive pressure exerted by the vapor is illustrated by diagram IX., showing the results of observations made at Vienna. The annual variation in vapor tension is given for the same station in the following diagram, No. X. By the relative humidity is meant the absolute humidity expressed as a fraction of the total quantity of moisture that the air would contain if perfectly saturated at its observed temperature.
As to its diurnal variation, the relative humidity is least in the hottest portion of the afternoon, and greatest shortly before sunrise, as shown in diagram XI.; similarly, as to its annual variation, it is least in the summer months and greatest in the winter, as shown by comparing the curves for January and July in the same diagram, or more fully by the annual curve (R. II.) given in diagram X., where a comparison between the humidity and the temperature can be easily made, The irregularity of geographical distribution of moisture is by no means so great as might be expected.

Diagram IX. - Diurnal Change of Vapor Pressure.
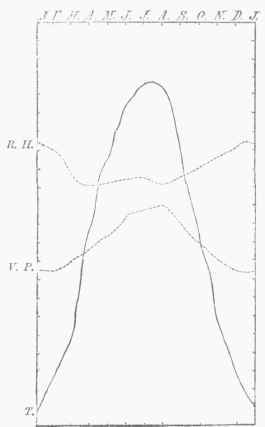
Diagram X. - Annual Changes of Relative Humidity (R. H.), of Vapor Pressure (V. P.), and of Temperature (T.).

Diagram XI. - Diurnal Change of Relative Humidity.
It is true that in the interior of North America and of Asia the air at the surface is rarely if ever completely saturated; but on the other hand, the monthly and annual averages show that a very large amount of aqueous vapor is always present even in those regions, notwithstanding their comparative dryness. The distribution of moisture in reference to altitude above the sea was for a long time supposed to follow the law suggested by Dalton (1806), namely, that it was expanded throughout the atmosphere precisely as if constituting an independent vaporous atmosphere within the gaseous one; but the later researches of Re-gnault, Bessel, Straehey (1801), and Hann (1874) have shown the fallacy of this theory. According to Hann, the pressure diminishes as we ascend more rapidly than it should according to Dalton's law, and the weight of the vapor existing in a vertical column above a given place is only 0-22 of what his law would indicate: live tenths of the aqueous vapor is within (5,500 ft. of the surface of the sea, and the strata under 20,000 ft. in altitude contain nine tenths of the vapor in the entire atmosphere.
The ratio between the quantity of vapor at a given height and that at the surface is shown in the following table, as deduced by Hann from balloon and mountain observations:
Altitude, feet. | Quality of vapor. |
0 | 1.00 |
1.000 | 0.87 |
2,000 | 0.80 |
3,000 | 0.73 |
4,000 | 0.64 |
5,000 | 0.56 |
6,000 | 0.56 |
7,000 | 0.48 |
Altitude, feet. | Quantity of vapor |
8,000 | 0.42 |
10,000 | 034 |
12.000 | 0.27 |
14,000 | 0.23 |
1(5,000 | 0.18 |
18,000 | 0.16 |
20.000 | 0.13 |
22,000 | 0.07 |
On the other hand, the irregularities of the distribution of vapor are such that the observations made in England in balloons show that layers of moist and dry air may alternate with each other. In the United States, and generally in continental situations, it is probable that such alternations only attend storms. The relation between moisture and the direction of the wind is expressed graphically by the so-called hvgro-metric wind rose, which gives for each direction of the wind the average force of vapor and relative humidity. The following table shows these relations for some of the few stations for which the computations have been made:
Wind Rose Hygrometric
WIND. | FORCE OF VAPOR | RELATIVE HUMIDITY. | ||
London. | Halle. | |||
Winter. | Summer. | Winter. | Summer. | |
in. | in. | per ct. | per ct | |
N.. | 0.21 | 0.42 | 89 | 68 |
N. E.. | 0.20 | 0.41 | 91 | 67 |
E.. | 0.19 | 0.49 | 93 | 61 |
S.E.. | 0.27 | 0.54 | 86 | 66 |
S... | 0.32 | 0.60 | 83 | 67 |
S.W... | 0.32 | 0.54 | 82 | 70 |
W.. | 0.28 | 0.49 | 81 | 71 |
N.W... | 0.24 | 0.44 | 83 | 69 |
N.. | 0 21 | 0.42 | 89 | 68 |
The relative dampness of the easterly winds and the dryness of the westerly winds is well shown by this table for Europe. We also see that the fact that the summer winds are dryer than the winter is due to their increased temperature and capacity for vapor, and not to any diminution in the quantity of vapor held by them, since the latter is in summer larger than in winter.
5. Precipitation Of Aqueous Vapor
This is apparent under the forms of cloud, fog, dew, and rain, and their various modifications, and produces a local diminution in the barometric pressure. The quantity of dew admits but very rarely of precise measurement, the most satisfactory series of experiments having been made by Dr. W. C. Wells in London. (For many details concerning it, see Dew, and Frost.) However important an abundant dew may be to the husbandman, it can scarcely be considered by the meteorologist as other than a local and temporary phenomenon, of minor importance in the general economy of the atmosphere. The formation of fog is but little more important in this connection. (See Fog.) Of more importance to all classes must be esteemed the formation of clouds and rain. (See Clouds, and Rain.) Clouds, according to the commonly received classification of Howard (1802), are divided into the cirrus, stratus, cumulus, and nimbus, for which latter Poey (1872) has proposed to substitute the pallium or sheet cloud. Howard intended by the term nimbus to designate those clouds from which rain was falling; but it does not appear certain that rain may not occasionally fall from either the stratus, the cumulus, or the pallium, or from the numerous combinations of these typical forms.
The presence of clouds and the phenomena displayed by them are valuable to the meteorological observer, both as affording him an indication of the direction of the upper currents of air, and as giving some clue to the moisture and temperature there prevailing. For the present we have principally to do only with the average percentage of cloudiness, and its influence upon the temperature. A diurnal periodicity, showing two maxima and two minima in the percentage of cloudy sky, will be perceived by the most cursory observer; the hours at which these occur vary with the kind of cloud; for the cumulus they are, maximum at 3 P. M., minimum at 5 A. M.; for the stratus, maximum at 6 A. M., minimum at 3 P. M. In mountainous countries it is easy to trace the direct dependence of this periodicity upon the heating of the soil during the day time and the cooling of the air by radiation during the night time; but the daily period is also distinctly pronounced within the tropics, and is clearly seen whenever a station in the temperate zone is in the interior of the continent within the range of an area of relatively dry air.
The total percentage of all kinds of clouds is shown for two European stations in the following table for January and July:
Diurnal Variation In Cloudiness
HOUR. | AT CREFELD. | AT PRAGUE. | ||
January. | July. | January. | July. | |
Midnight. | ... | .. | 75 per ct. | 49 per ct. |
1 A. 31. | .. | .. | .. | .. |
2 | .. | . | 73 | 45 |
3 | ... | .. | .. | .. |
4 | .. | .. | 65 | 46 |
5 | .. | . . | .. | .. |
6 | .. | .. | 74 | 51 |
7 | 82 | 63 | .. | .. |
8 | ... | 76 | 49 | |
9 | 77 | 62 | .. | .. |
10 | .. | .. | 74 | 54 |
1l | 76 | 66 | .. | .. |
Noon. | ... | .. | 73 | 58 |
1 P. M. | 76 | 67 | .. | |
2 | . . | .. | 73 | 56 |
3 | 74 | 66 | .. | |
4 | . , | 73 | 57 | |
5 | 73 | 63 | .. | |
6 | . . | 73 | 54 | |
7 | 69 | 59 | .. | |
8 | .. | 75 | 54 | |
9 | 67 | 58 | .. | .. |
10 | .. | .. | 73 | 48 |
11 | 70 | 53 | .. | ....... |
Midnight. | •• | •• | 75 | 51 |
An annual periodicity in the cloudiness is also observed (see the following table), having its maximum in the winter time throughout the temperate zones, while within the polar circle the maximum cloudiness may be placed in the late summer and fall.
Annual Variations In Cloudiness
MONTH. | AT CREFELD. | AT PRAGUE. |
January.................... | 74 per ct. | 73 per ct. |
February:................... | 72 | 70 |
March... | 66 | 62 |
April....................... | 62 | 54 |
May........................ | 66 | 52 |
June.... | 65 | 53 |
July........................ | 62 | 51 |
August..................... | 58 | 49 |
September... | 57 | 51 |
October... | 65 | 68 |
November... | 77 | 76 |
December... | 74 | 74 |
As regards the geographical distribution of cloudiness, it may be remarked briefly that the annual averages show a minimum cloudiness in the regions of the trade winds and in the interior of continents, and a maximum in mountainous districts, the polar regions, and on the western coasts of the continents. The relation between the direction of the wind and the average degree of cloudiness is known to all, and is rendered apparent by the following table:
Percentage Of Cloudiness For Each Wind Direction
WINDS. | CARLSEUHE. | VIENNA. | ||
Winter. | Summer. | Winter. | Summer. | |
N........... | 63 | 46 | 75 | 45 |
N. E.......... | 56 | 82 | 74 | 26 |
E............. | 56 | 29 | 68 | 25 |
S. E.......... | 69 | 43 | 71 | 25 |
S... | 80 | 59 | 70 | 87 |
S. W.......... | 82 | 62 | 69 | 43 |
W............ | 80 | 58 | 65 | 56 |
N. W........ | 77 | 55 | 72 | 55 |
N............. | 63 | 46 | 75 | 45 |
The connection between the lunar phases and the cloudiness has been already spoken of. The influence of cloudiness in protecting the earth's surface against the direct rays of the sun, and against nightly radiation from the earth, has been investigated for a few stations only. According to Weilenmann (1874), the atmosphere, when the sky is clear, protects the earth against radiation by an amount equal to one third of the protection afforded by a cloudy sky, whence the latter may be concluded to allow on the average scarcely 15 per cent, of the solar heat to reach the earth's surface. The connection between cloudiness and barometric pressure has not yet been studied with the care it deserves; but it is certain that a low barometer corresponds to an increased cloudiness, and an important portion of the daily variation in the barometric pressure depends upon the formation of dew or fog at night and of cumulus clouds by day. The rainfall may be considered as the completion of the process of the formation of clouds, although probably the majority of clouds are dissipated without producing rain. The larger part of the rainfall is probably deposited by uprising currents of air, and therefore it has its daily and annual periods.
The formation of snow is apparently more directly dependent upon nocturnal radiation of heat. The measurement of rainfall by means of the simple rain gauge needs to be made under circumstances of great uniformity, if for different stations we would attain results comparable with each other. The most minute investigations of the laws governing rainfall have been made by Symons, and published since 1866, in his annual volumes of "British Rainfall." According to these results, which are abundantly confirmed by "other measures taken throughout the world, the quantity of rain received by a gauge diminishes in an irregular manner with the height of the gauge above the earth's surface. The diminution is apparently to be attributed principally to the greater velocity of the wind at the higher station, and amounts to 10 per cent, of the whole rainfall for an elevation of 20 ft., and in one exceptional case, at the height of 50 ft., to 40 per cent, of the rainfall at the surface. The study of the diurnal period of the precipitation (including rain and snow) has as yet led to only an imperfect result; but it is believed that as a general rule, in the temperate zones, a maximum occurs in the afternoon in the summer, but before sunrise in the winter months.
The annual variation in rainfall depends almost exclusively upon the relation between the winds and the geographical position and topographical details of the country. On the W. coast of North America and of Europe the greater part of the annual rainfall occurs in winter, but in the interior of Europe and on the E. coast of the United States in summer. The geographical distribution of the snow and rainfall over the world can be properly presented only by means of a very large and detailed chart; its general distribution over the United States is shown by the accompanying map (XII.), compiled by Sehott for the Smithsonian institution, from all the data available in 1872. ^ The heaviest rainfall occurs in those countries in which warm moist monsoon winds blow from the seacoast up over rapidly rising hills. Thus the animal rainfall on the Cossyah hills, facing the bay of Bengal, is Goo inches, but 20 m. further inland it is reduced to 200 inches, and at 3d m. to 100. The connection between rainfall and the direction of the wind presents therefore an apparent discrepancy in various parts of the world, even for stations on the same parallel of latitude, according as the winds ascend in their course from the ocean level to hilltops, or descend from the mountains and plateaus to the lowlands.
The percentage of rainy and not rainy winds is given for London in the following table, which shows that 69 per cent, of the days when S. W. winds prevail are rainy, while only 33 per cent, of the E. and N. E. winds bring snow or rain:
Relation Between Rainy Days And The Direction Of The Wind At London
WIND. | Total number of nations. | Total number of rainy winds. | Percentage of rainy winds. |
s. w........ | 1,965 | 1,321 | 69 |
w........... | 932 | 476 | 51 |
N. w........ | 1,816 | 754 | 41 |
N............ | 530 | 191 | 36 |
N.E........ | 1,1:34 | 379 | 33 |
E............ | 6.9 | 230 | 33 |
S. E......... | 722 | 337 | 47 |
S | 376 | 256 | 68 |
Variable ... | 441 | 217 | 49 |
Calm........ | 94 | 0 | 0 |
For the United States this relation may be presented in another form. Out of 100 cases of rain or snow the average number occurring with the different winds is as follows:
Percentage Of Wind On Rainy Days
WIND. | New Haven. | |
N .... | 8 | 2 |
n.E.. | 37 | 10 |
E..... | 6 | 1 |
S. E... | 19 | 9 |
S | 7 | 10 |
WIND. | N'ew Haven. | Cincinnati. |
S.W.. | 15 | 25 |
w..... | 1 | 18 |
N. W.. | 7 | 25 |
N | 8 | 2 |
On the other hand, we have very few analyses of automatic records showing the relation between the quantity of rain and the direction of the wind. The following example for Lisbon will illustrate this connection:
Average Annual Quantity Of Rainfall For Each Direction Of The Wind At Lisbon
WIND. | Rainfall, inches. |
N | 0.51 |
N.N. E...... | 071 |
N.E ..... | 0.39 |
E. N. E...... | 0 32 |
E. | 0.43 |
E.S.E..... | 1.54 |
S.E........ | 1.30 |
S. S. E. ... | 1.65 |
S ...... | 3.39 |
WIND. | Rainfall, inches. |
s | 3.39 |
s. s. w...... | 5.04 |
s. w........ | 4.84 |
w. s.w...... | 5.79 |
w ... | 2.05 |
W. N.W..... | 1.18 |
N.W.. | 110 |
N.N. W.... | 0.55 |
N___ | 0.51 |
6. Barometric Pressure
It is only when we come to study the pressure of the atmosphere, as shown by the barometer, that we arrive at a connected intelligible view of the peculiarities of weather and climate. In fact it is evident that no portion of the atmosphere can be moved from one region to another, except under the influence of a pressure applied in the direction of its motion; such movement is simply an effort to reestablish a disturbed statical equilibrium. The laws of mechanics show that relatively to the earth's surface the air would remain quiescent if the sun were absent; but the density of the atmosphere is disturbed by the solar heat, by the variable quantity of aqueous vapor rising from the oceans and continents, and by the local condensation of this vapor into cloud and rain. In this way temporary abnormal inequalities in the distribution of barometric pressure are produced, which give rise to the winds, and afford the meteorologist that connecting link which enables him to unite the whole circle of atmospheric phenomena into a harmonious system. (See Barometer.) The height of the barometric column is found to vary at the same station in regular diurnal and annual changes, and also in a non-periodic manner; on moving the instrument to other places, its height is found to vary with the geographical position, and in an especially remarkable degree with every change of altitude.
The latter class of changes have been the subject of numerous profound investigations, having for their ultimate object both the utilization of the barometer for hypsometric purposes, and the solution of the inverse problem, the reduction of actual barometric readings to the sea level. The solutions of both these problems can as yet be satisfactorily effected only in respect to annual means; but within allowable limits of error approximate methods may be applied to monthly means and to individual observations, when the altitude of the station docs not exceed 2,000 ft. The systematic variations in the barometric pressure can be best shown graphically, and it will suffice to present only a few typical cases. The existence of a perceptible lunar tide in the atmosphere is now no longer considered probable, and the important periodic changes all depend upon the sun. The diurnal changes, as shown in diagram XIII. for Nertchinsk, Siberia, and Plymouth, England, illustrate respectively the continental and maritime stations.
The effect of elevation above the surrounding country (not merely above sea level) is seen in the contrasts between the diurnal changes at Geneva (altitude 1,335 ft.) and at the summit of Mt. St. Bernard (8,114 ft.), as shown in diagram XIV., both for January and July. At the sea level, two maxima and two minima of pressure occur during each 24 hours; the maxima between 9 and 11 A. M. and between 9 and 11 P. M., the minima between 3 and 5 P. M. and between 2 and 5 A. M., respectively. The annual barometric changes are shown in diagram XV. as given by Lorenz and Rothe (1874) for typical stations, whence the great influence of geographical position is easily seen. A clearer perception of the important part played by aqueous vapor will be obtained if from the whole atmospheric pressure shown in diagrams XIII., XIV., and XV. we subtract that portion due to aqueous vapor, as shown in diagrams IX. and X.; the remainder is technically known as the pressure of the dry air, or the gaseous atmosphere. It is found that the gaseous and the vaporous components have each a single diurnal and annual fluctuation, and that it is the combination of these that produces the irregular and even double fluctuations in the total pressure shown in the preceding diagrams.
A general view of the annual barometric changes, and a more complete insight into the relation between pressure, wind, and weather, are obtained by the comparison of a series of charts, such as VII. and VIII., which show for the respective months the average distribution of the pressure of the atmosphere over the surface of the globe. The variations of barometric pressure with the latitude were first definitely established by Schouw (1832), although assorted by Clark (1776) and Humboldt (1807). The variations which occur on the same parallel of latitude and especially the seasonal differences between the pressures over the land and the ocean, were first elaborated by Buchan (1868). The charts VII. and VIII. are compiled from the latest results published by Buchan and by the admiralty office in London, and must be considered as representing very nearly the actual distribution of barometric pressure over the globe, as reduced to a uniform sea level. The irregular or non-periodic variations of the pressure are intimately connected with the disturbances or storms which sweep over the earth. (See Hurricane, and Storms.) The regions of greatest average irregular barometric variations coincide in general with the regions of most decided alternations between clear, cold, dry weather, and cloudy, warm, moist, or rainy weather.
In analyzing this connection between pressure and weather, we will only mention the relation between the barometer and the winds and rain. The general connection between the changes of pressure at any place and the winds is shown in the following table, which gives the average reading of the barometer during the prevalence of the respective winds for a few typical stations in the northern hemisphere; in these cases, as for the entire globe, the pressure is greatest for cold or dry winds, and least for warm or moist winds, which law obtains in both the winter and summer seasons:
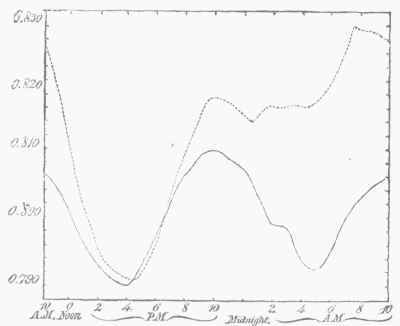
Diagram XIII. - Diurnal Variations in the Barometer.
The dotted line is for Nertchinsk, Asia continental station; the full line, for Plymouth, Eng., maritime station.
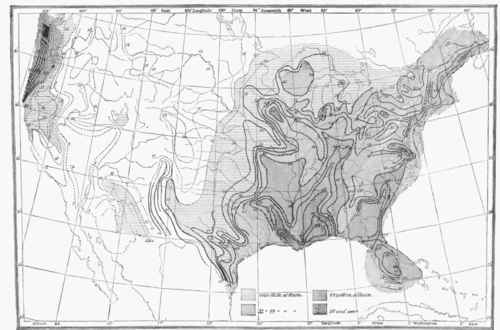
Diagram XII. - Rain Chart of the United States, showing by Lints the Distribution of the Mean Precipitation in Rain and Melted Snow for the Year.
The numbers indicate the rainfall in inches; the dotted lines are approximations.

Diagram XIV. - Diurnal Variations in the Barometer.
The full lines are for St. Bernard; dotted lines for Geneva.

Diagram XV. - Annual Variations in Atmospheric Pressure.
Relation Between The Wind Direction And The Barometric Pressure
WIND DIRECTION'. | ST. PETERSBURG. | LONDON. | VIENNA. | |||||
Winter. | Summer. | Winter. | Summer. | Winter. | Summer. | Winter. | Summer. | |
inches. | inches | inches. | inches. | inches. | inches. | inches. | inches. | |
N............... | 28.111 | 23.023 | 29.974 | 29.997 | 29.781 | 29.732 | 29.433 | 29.366 |
N.E............ | 23.133 | 28.036 | 29.972 | 30.040 | 29.786 | 29.731 | 29.455 | 29.361 |
E............... | 23.290 | 23.065 | 29.885 | 30.057 | 29.721 | 29-695 | 29.466 | 29.259 |
S.E............ | 23.311 | 23.023 | 29.746 | 20.982 | 29.693 | 29.626 | 29.412 | 29.259 |
S | 28.189 | 27.982 | 29.724 | 29.852 | 29.614 | 29626 | 29.331 | 29.233 |
S. W........... | 28.129 | 28.003 | 29.849 | 29.799 | 29.687 | 29.622 | 29.171 | 29.242 |
w.............. | 23.055 | 28.039 | 29.962 | 29.862 | 29.651 | 29.642 | 29.272 | 29.234 |
N. W........... | 27.944 | 28.036 | 29.977 | 29.946 | 29.708 | 29.703 | 29.362 | 29.296 |
N............... | 28.111 | 28.023 | 29.974 | 29.997 | 29.781 | 29.732 | 29.433 | 29.366 |
The relation between atmospheric pressure and rainfall depends upon the direction of the ac-companying wind; but if, as in the following table, each wind direction be treated by itself, it will be seen that during rain and snow the pressure is usually below the average for that wind, and is falling still lower for southerly winds and increasing rain, but is rising for northerly winds and clearing weather:
Barometric Variations Preceding And Following Rain
WIND. | Depression of barometer below the general average for the respective winds at Berlin. | Change in the barometer at Stockholm during the twenty-four hours. | ||
During rain | Duringsnow. | Preceding rain. | During rain. | |
inch. | inch. | inch. | ||
N..... | 0.143 | 0.242 | + 0.037 | + 0.053 |
N.E...... | 0144 | 0 263 | +0.005 | + 0039 |
E...... | 0.113 | 0.226 | - 0.001 | -0.036 |
S.E...... | 0.109 | 0.203 | - 0014 | - 0.058 |
S... | 0.109 | 0.202 | -0.1136 | - 0.054 |
S.W... | 0.087 | 0.174 | - 0.063 | - 0.023 |
W. | 0.059 | 0.139 | + 0.012 | + 0.020 |
N. W..... | 0.109 | 0.169 | + 0.027 | + 0.094 |
N....... | 0.143 | 0.242 | + 0.037 | + 0.015 |
I he connection between the temperature, pressure, wind, and weather may be briefly indicated in the so-called weather rose, examples of which are presented for central Europe and for a portion of the United States in diagrams XVI. and XVII - We here terminate our presentation of some of the more interesting relations between those meteorological phenomena which admit of exact observation, and which form a safe basis for further philosophical investigations. - Deductive Meteorology. Of meteorology as an inductive science, the preceding pages and the various articles referred to therein may serve to give us some faint idea; of it as a deductive science it would seem premature as yet to speak, were it not that the foundations of this new meteorology are now apparently well laid, although it must be confessed that the passage from crude observations back to the unknown laws of the invisible forces which guide these most complex operations of nature is not yet completely open to the student. The attempts to predict the weather, and especially storms, which are now daily made by the meteorological offices of numerous civilized nations would of themselves seem to imply the existence of a deductive science more or less developed.
This however is not necessarily the case, for it has been found practicable, on the one hand, by means of the telegraph, to collect in a few hours material for compiling a daily weather map for the whole of Europe or the United States, and, on the other hand, to apply to such maps the numerous generalizations that have been found to hold good for the respective portions of the world; a process which, repeated from day to day, reminds one of the methods adopted in astronomy for computing special perturbations. There seems to be no good reason for speaking disparagingly of meteorology as a science, since, whether we study the stars, the atmosphere, atoms, or organic nature, we find ourselves everywhere confronted by an overwhelming mass of phenomena which are subject as yet only to an inductive philosophy. Owing to the infinite number of combinations among the meteorological elements, no empirical rules can invariably lead to correct predictions; but the calculus of probabilities shows that over 50, and often 75 per cent, of our predictions should be well verified, a conclusion in harmony with actual experience throughout the world.
But this percentage of verifications, we have reason to believe, is sensibly greater when the predictions are based not merely upon empirical rules, but equally upon a consideration of such general principles as must form the groundwork of the true deductive science. The foundations of the new meteorology are necessarily found in the simple laws of mechanics. They have been considered by several authors, but by none with so much completeness as in the work of Ferrel "On the Motions of Fluids and Solids, relative to the Earth's Surface" (Nashville, 1854, and New York, 1800). In this treatise the motions and figure of the atmosphere are first treated of, on the hypothesis that no resistance is offered by obstacles or by friction upon the earth's surface; in a subsequent section the influence of such resistance is considered, on the hypothesis that a uniform coefficient of friction obtains over the whole earth's surface. Mr. Ferrel thus deduces the necessary existence of two belts of high barometric pressure, extending entirely around the globe between the tropics and the parallels of 30° N. and S. respectively, and of a belt of low pressure at the equator, as well as regions of low barometer within the arctic and antarctic circles; belts of calms near the equator, the tropics, and the polar circles are also deduced.
The continents and oceans offer very unequal frictional resistances, which causes the equatorial belt of calms to lie on the average a little north of the true equator in the Atlantic and Indian oceans, but nearly on the equator in the Pacific ocean. Similarly, it can be shown that to the irregular distribution of the friction of the continents is partially due the breaking up of all these belts into segments lying respectively over the ocean and the continents. In general the motion of the earth's atmosphere is a consequence of the unequal heating by the sun of the equatorial and polar regions; the subsequent effort of nature to establish statical equilibrium relative to the earth's surface is that which gives rise to the phenomena of the winds. The unequal heating of the continents and oceans, due to their unequal specific heats and radiating power, and to the annual vibration of the sun between the tropics, is the principal cause of the breaking up of the belts of temperature, pressure, and winds into continental and oceanic areas.
But whatever induces a local or general change in the density of the air disturbs its equilibrium and necessitates its motion; and the disturbing power next in importance to the solar heat is the diffusion of aqueous vapor, the density of which is only six tenths of that of dry air at the same pressure and temperature. It thus happens that the combined effect of friction, temperature, and moisture gives rise to the variable distribution of barometric pressure exhibited in the charts VII. and VIII., which show areas of high barometer existing in winter over the continents, but in summer over the oceans, and over the eastern half of each ocean, rather than over its central portions. The general distribution of barometric pressure having been thus deduced by Mr. Ferrel, he then considers the local disturbances known as cyclones, tornadoes, etc, all the phenomena of which are deducible from his initial mechanical formulas (see "Bulletin of the Philosophical Society of Washington," June, 1874, and the "American Journal of Science," November, 1874), if we supplement these by the researches of Him, Peslin, and Reye.

Diagram XVI. - Weather Rose for Central Europe.

Diagram XVII. - Weather Rose for Eastern and Middle United States.
These latter have applied to the phenomena of the atmosphere, and especially to its vertical motions, those laws of thermodynamics which were first fully insisted on by Espy in "The Philosophy of "Storms " (1841), but which required the accurate experiments of Regnault and the analysis of Clausius, Thomson, and others, to make them available quantitatively, as well as qualitatively, for meteorological purposes. The above mentioned authors have shown the connection that must exist between the expansion of uprising moist air (whether it be pushed by winds up over elevated regions, or ascend on a hot day in consequence of local rarefaction), and the formation of clouds and rain, deducing thereby, with great minuteness, many of the details of the origin, growth, path, and decay of storms. Finally, the phenomena of radiation and absorption of heat, though as yet only partially deducible from correct physical theories of the constitution of gases, may still be looked upon as well determined experimentally by the observations of Tyndall and others, as far as regards the constituents of the-atmosphere, and form the basis of the reasoning by which we are able to deduce the general laws of the periodic and non-periodic changes of temperature and moisture.
We are thus in a position to reduce all meteorological phenomena to the three principles involved in general mechanics, thermodynamics, and molecular physics; and it may be confidently expected that the increasing powers of mathematical analysis will ere long enable us to rear upon these a superstructure of deductive meteorology, whose application to the explanation and even the prediction of the weather will be limited only by the extent and accuracy of our observations.
Continue to:
My Books

