The Reproduction Of Light And Shade In Photography. Part 3
Description
This section is from the book "The Fundamentals of Photography", by C. E. K. Mees,. Also available from Amazon: The Fundamentals Of Photography.
The Reproduction Of Light And Shade In Photography. Part 3
If we join all these points together instead of representing them as a staircase effect, as is shown by dotted line in Fig. 72, we get a smooth curve, Fig 73, of which the straight line portion (B to C) represents the period of correct exposure, while the more or less curved portions at the beginning and end of the curve correspond to the periods of under-exposure and over-exposure.
It must be realized that no ordinary negative can show the whole range of exposures from beginning to end of this curve. This is because the range of brightnesses covered by the whole curve is much greater than that which occurs in ordinary subjects and consequently it is quite possible to represent an ordinary subject entirely in the period of correct exposure, avoiding both the period of under-exposure and the period of over-exposure. If, therefore, we wish to obtain a technically perfect negative, we must expose so that the subject which we are photographing falls into this period of correct exposure, when we shall obtain a negative in which there will be no wholly transparent film, since this would mean that we had entered the period of under-exposure, and there will be no blocked up masses of silver since this would mean that the negative was over-exposed. The capacity of a photographic material to render the scale of tone values correctly is, therefore, entirely a matter of the length of the straight line portion of the curve, and it is the length of this straight line portion in the case of Kodak film which gives its well-known "quality" to the material. By the use of a material of this kind which has a long straight line portion to the curve, and of an exposure which will place the scale of intensities on that straight line portion we can correctly translate the tones of the subject into corresponding opacities in the negative and obtain a technically perfect negative.
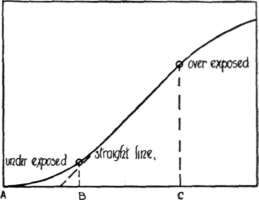
Fig. 73. Curve Showing Under, Correct and Over-exposure.
When we come to the second step of the process, however, and make a print from this negative, we find that however carefully we choose our exposure and development perfect reproduction in the print is unobtainable. For a negative material the relation between the silver deposit and the increase of exposure is given by a curve similar to that shown in Fig. 73, and in this curve the straight line portion (B to C) represents the period of correct exposure, so that to obtain perfect reproduction in the negative we must expose so that the whole range of brightnesses in the subject falls within this period of correct exposure, none of the tones being represented by densities in the negative which fall on the curved portions at the beginning and end of the curve corresponding to the periods of under and over-exposure.
When we make a print, however, we cannot do this because in a print we are forced to use the whole range of reflecting power of the printing paper; we must have highlights which are almost white paper, and shadows which are as black as the silver deposit will give. This is necessary because the total range of tones which can be obtained by reflected light is none too great for the reproduction of natural subjects, while in negatives, where the light is transmitted instead of reflected, the available range is enormous and we need make use of only a small portion of it. This is also true in the case of transparent positives such as lantern slides and motion picture films, which give the best rendering of any printing material.
We can try the effect of an increasing series of exposures upon a printing paper in exactly the same way as upon a film, that is, we can give a first exposure just sufficient to get a barely perceptible image after development, then expose another portion for twice the time, another for four times, and so on. Now instead of measuring the light transmitted by the various densities, as we did in the case of the film, we must measure the light reflected from them. We get a series of "reflection densities" on paper correspond-to the transmission densities of the film and we can express the result in the form of a curve just as we did in the case of the film. Thus in Fig. 74 we see that the densities increase gradually at first, as shown on the lower portion of the curve, then grow in equal steps for equal increases of exposure, as with the film, and then the increase not only grows less, but very soon stops altogether, as shown by the upper portion of the curve. This result only occurs with a film with very great exposures indeed, since after a film begins to be over-exposed there is still a considerable range of exposures before the increase of density with exposure actually ceases. Therefore, a paper is seen to differ from a film in that we rapidly reach a point where we have obtained the maximum blackness of deposit which the sensitive emulsion is capable of giving and where no further increase of exposure will enable us to obtain a more intense black.
The reason for this is that with the paper we are dealing with reflected light, and not with transmitted light, as in the case of the film, and the light is reflected from three surfaces-from the surface of the gelatine, from the surface of the silver deposit, and that which is not absorbed in passing through the silver deposit is reflected from the paper beneath.
The rule for correct rendering of tones on the paper is the same as for the negative; that is, the tones which fall on the straight line portion of the curve are rendered correctly, and those which fall on the top and bottom portions of the curve do not reproduce the tones of the negative in their correct position. As has already been said, however, the difference is that in the negative we can generally confine the scale of the subject to the straight line part of the curve, while in printing we are forced to use the whole curve, including those portions which cannot give a perfectly correct rendering of the tones of the negative.

Fig. 74. Curve of a Printing Paper.
Different papers sometimes show very different curves; thus in Fig. 75 we see the way in which two different papers give their scales of tones; both give the same range of tones, both require the same range of exposures to give the entire range of tones, but in the one the deposit grows evenly with the increase of exposure while in the other the curve is scarcely straight at all. The paper showing the even growth of deposit will give a correct rendering of the tones of the negative throughout the greater part of its curve (shown by dotted line in Fig. 75) and it is generally said that such a paper has good "quality" while the paper with the uneven growth (solid line Fig. 75) has poor "quality". For papers, therefore, as well as for negative-making materials, quality depends upon the proportion of the curve which is a straight line, and the straighter the curve the better the quality.
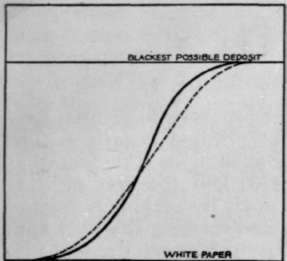
Fig. 75. Curves Showing Good and Poor "Quality" in a Printing Paper.
Continue to:
My Books

