Plotting A Survey
Description
This section is from the book "Cassell's Cyclopaedia Of Mechanics", by Paul N. Hasluck. Also available from Amazon: Cassell's Cyclopaedia Of Mechanics.
Plotting A Survey
In explaining the method of plotting a survey by the use of co-ordinates, it may be stated that in the survey of a piece of Land a system of triangulation must be laid out, the junctions of the lines to be chained being marked by station poles. The lines should approximate to the boundaries, and such additional lines taken as will form up the boundaries into a series of triangles. Each triangle is theoretically perfect when the length of the three sides is known, but practically it is necessary to cause another line to cross the triangle to check the measurements. The triangles are plotted by the length of their sides and checked by the crossing of the additional lines at the points indicated in the field book. Outside each external line will be an offset piece between the chain line and the boundary; this is plotted by co-ordinates - that is, distances and offsets. For example, the field book shows one of the lines thus, meaning that it is line 3, and the approximate direction is down to the right after leaving line 2. A station occurs at the commencement of the line shown by a circle with a dot in it, the same station having previously occurred at 2.10 on line 2, and the boundary is on the left of the line at a distance of 7 links square to the chain.
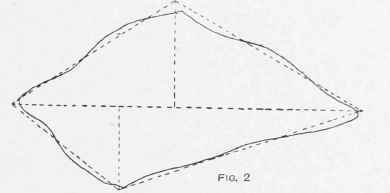
At 0.50 - that is, 50 links along the chain line - the boundary goes out to 19 links, at 1.20 (1 chain 20 links) it comes in to twelve links, then goes out again to 15 links at 1'80, at 2.30 comes in to 8 links, and at the end of the line at 292 it comes in to 2 links. These distances and offsets plotted to scale are shown in the accompanying Fig. 1; the small circles show stations, the large circle with the number in it gives the number of the line, and the arrow-head shows the direction in which it was measured. In practice the offset lines are usually omitted, points being made in the right places and the boundary sketched through. When the whole plan is plotted the chain lines are put in red (crimson lake) and the boundaries in black (Indian ink) and the pencil lines rubbed off. Then equalising lines are drawn through the boundaries and a new set of triangles laid down on the plan, as in Fig. 2. The base and perpendicular of each are measured by scale, and the calculation of area is made from the dimensions so found.
Fig. 1.
Plotting a Survey.
2 | 2.92 |
|
8 | 2.30 | |
15 | 1.80 | |
12 | 123 | |
19 | 0.50 | |
7 | 0.00 |
|
(3) |
|
Continue to:
My Books

