101. The Demand Curve
Description
This section is from the book "Introduction To Economics", by Frank O'Hara. Also available from Amazon: Introduction To Economics.
101. The Demand Curve
The demand schedule in the preceding paragraph may be graphically represented by the following demand curve.
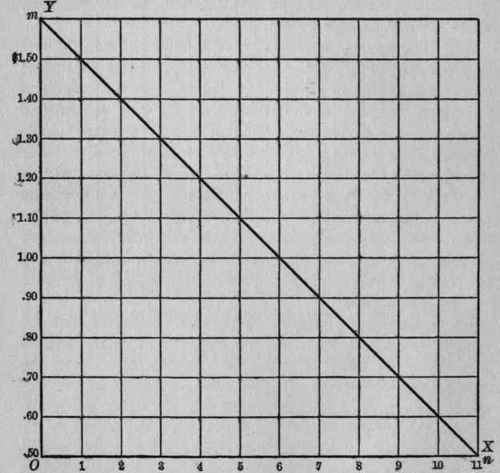
Figure III. - Demand Curve.
In the above figure the quantity of the good x is measured along the fine OX. The maximum prices which purchasers are willing to pay if necessary in order to secure the good under different conditions of supply are represented by lines parallel to OY. The curve mn connecting the upper ends of the parallel lines is the demand curve. Perpendiculars to OX cut by this curved line represent the price which will be paid for a unit of the given commodity in the assumed market under different conditions of supply and under competitive conditions. Thus, there will be a demand for one unit at price $1.50; for two units at price $1.40; for three units at price $1.30, etc.
Continue to:
My Books

