


5.10.2.3. Single-process extensive reporting system
Description
This section is from the "Practical mod_perl" book, by Stas Bekman and Eric Cholet. Also available from Amazon: Practical mod_perl
If you need to get in-depth information about a single process, just click on its PID. If the chosen process is a mod_perl process, the following information is displayed:
Process type (child or parent), status of the process (Starting, Reading, Sending, Waiting, etc.), and how long the current request has been being processed (or how long the previous request was processed for, if the process is inactive at the moment the report was made).
How many bytes have been transferred so far, and how many requests have been served per child and per slot. (When the child process quits, it is replaced by a new process running in the same slot.)
CPU times used by the process: total, utime, stime, cutime, cstime.
For all processes (mod_perl and non-mod_perl), the following information is reported:
General process information: UID, GID, state, TTY, and command-line arguments
Memory usage: size, share, VSize, and RSS
Memory segments usage: text, shared lib, date, and stack
Memory maps: start-end, offset, device_major:device_minor, inode, perm, and library path
Sizes of loaded libraries
Just as with the multi-process mode, this mode allows you to automatically refresh the page at the desired intervals.
Figures Figure 5-4, and Figure 5-5 show an example report for one mod_perl process.
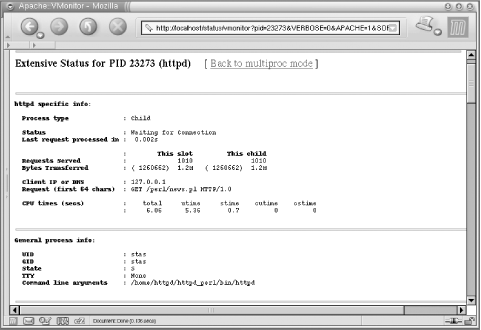
Figure 5-3. Extended information about processes: general process information
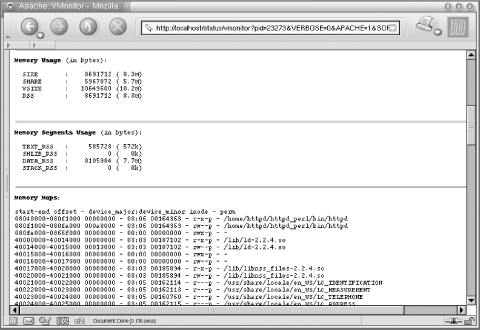
Figure 5-4. Extended information about processes: memory usage and maps

Figure 5-5. Extended information about processes: loaded libraries
Continue to:
Books by Stas Bekman:


My Books

