(10) Reaction Time For Speaking 4-Letter Words
Description
This section is from the book "Human Vitality And Efficiency Under Prolonged Restricted Diet", by Francis G.BENEDICT, Walter R. Miles, Paul Roth, And H. Monmouth Smith. Also available from Amazon: Human Vitality and Efficiency Under Prolonged Restricted Diet.
(10) Reaction Time For Speaking 4-Letter Words
When a list of 25 familiar 4-letter words is presented in chance order, the reaction time for responding to such stimuli is approximately twice that of the eye-reaction time.1 In tables 171 and 172 for Squads A and B, respectively, the average reaction time, with the standard deviation and the coefficient of variability, is recorded for each subject and for each session. The word reactions were first taken at the second experimental session with each squad, hence there are no normal values for Squad A. There are 4 normal dates for Squad B. Word reactions were taken on 9 evenings with Squad A. The averages for these individual subjects are at the bottom of table 171 and range from 415 σ for Bro to 597 σ for Can, with a total average for the 10 men of 486 σ. The coefficient of variability for the individual series of reactions is from 7 to 13 per cent of the reaction time, the average for the 10 subjects being 9.3 per cent. These average figures for Squad A compare fairly well with the results found with normal subjects and during normal sessions by Dodge and Benedict,1 who report the average reaction time for a group of normal subjects as 455 σ and the average mean variation2 about 8.0 per cent of the average latency.
1As was shown by Dodge and Benedict, Carnegie Inst. Wash. Pub. No. 232, 1915, p. 100, there is an instrumental latency with this exposure apparatus amounting to 37 σ. The values which have been entered in the tables are simply for comparative purposes, and this factor has not been subtracted from them. The same is true of the published eye reaction data, where the instrumental latency is 20 σ. (See footnote, p. 163).
Table 171. - Squad A - Time And Variability Of Word Reaction
[M. in σ; S. D. in σ; and C. in per cent].
Date. | Reaction. | Bro. | Can. | Kon. | Gar. | Gul. | Mon. | Moy. | Pea. | Pec. | Spe. | Tom. | Vea. | Fre. | Av. |
1917. | |||||||||||||||
Oct. 13.. | M. | 444 | 679 | .. | 490 | 457 | 513 | 473 | 574 | 468 | 488 | 454 | 476 | 441 | 503 |
S.D. | 34 | 82 | .. | 49 | 63 | 64 | 77 | 62 | 54 | 46 | 45 | 58 | 51 | 58.8 | |
C. | 7.8 | 12.1 | .. | 10.0 | 13.8 | 13.8 | 16.3 | 10.8 | 11.5 | 9.4 | 9.9 | 12.2 | 11.6 | 11.8 | |
Oct. 27.. | M. | 413 | 658 | 550 | 472 | 439 | 512 | 458 | 527 | 440 | 554 | 465 | 470 | .. | 485 |
S.D. | 45 | 69 | 125 | 35 | 38 | 40 | 43 | 53 | 53 | 84 | 57 | 38 | .. | 47.1 | |
C. | 10.9 | 10.5 | 22.7 | 7.4 | 8.7 | 7.8 | 9.4 | 10.1 | 12.0 | 15.2 | 12.3 | 8.1 | .. | 9.7 | |
Nov. 10.. | M. | 436 | 566 | 506 | 478 | 443 | 491 | 439 | 507 | 452 | 485 | 530 | 475 | .. | 482 |
S.D. | 45 | 40 | 43 | 27 | 28 | 47 | 31 | 54 | 67 | 32 | 87 | 50 | .. | 47.6 | |
C. | 10.3 | 7.1 | 8.5 | 5.7 | 6.3 | 9.6 | 7.1 | 10.6 | 14.8 | 6.6 | 16.4 | 10.5 | .. | 9.8 | |
Nov. 24.. | M. | 414 | 576 | 514 | 455 | 443 | 499 | 518 | 514 | 483 | 508 | 438 | 468 | .. | 481 |
S.D. | 28 | 36 | 46 | 56 | 29 | 33 | 64 | 52 | 68 | 40 | 40 | 23 | .. | 42.9 | |
C. | 6.8 | 6.3 | 9.0 | 12.3 | 6.6 | 6.6 | 12.3 | 10.1 | 14.1 | 7.9 | 9.1 | 4.S | .. | 8.9 | |
Dec. 8.. | M. | 403 | 578 | 505 | 477 | 429 | 499 | 478 | 522 | 460 | 492 | 438 | 448 | .. | 473 |
S.D. | 30 | 37 | 62 | 43 | 34 | 48 | 54 | 41 | 72 | 37 | 31 | 31 | .. | 42.1 | |
C. | 7.5 | 6.4 | 12.3 | 9.0 | 7.9 | 9.6 | 11.3 | 7.9 | 15.7 | 7.5 | 7.1 | 6.9 | .. | 8.9 | |
Dec. 19.. | M. | 399 | 583 | 506 | 464 | 435 | 504 | 482 | 515 | 466 | . | 457 | 456 | .. | 476 |
S.D. | 26 | 29 | 49 | 40 | 21 | 36 | 49 | 41 | 64 | .. | 57 | 26 | .. | 38.9 | |
C. | 6.5 | 5.0 | 9.7 | 8.6 | 4.8 | 7.1 | 10.2 | 8.0 | 13.7 | ... | 12.5 | 5.7 | .. | 8.2 | |
1918 | |||||||||||||||
Jan. 12.. | M. | 397 | 568 | 501 | 477 | 463 | 565 | 556 | 549 | 507 | .. | 453 | 468 | ... | 500 |
S.D. | 28 | 36 | 45 | 44 | 20 | 47 | 50 | 60 | 61 | .. | 34 | 49 | .. | 42.9 | |
C. | 7.1 | 6.3 | 9.0 | 9.2 | 4.3 | 8.3 | 9.0 | 10.9 | 12.0 | .. | 7.7 | 10.5 | .. | 8.5 | |
Jan. 26.. | M. | 401 | 595 | 540 | 474 | 449 | 543 | 574 | 510 | 476 | .. | 547 | 451 | .. | 502 |
S.D. | 38 | 57 | 40 | 50 | 34 | 44 | 62 | 44 | 60 | ..... | 75 | 34 | .. | 49.8 | |
C. | 9.5 | 9.6 | 7.4 | 10.5 | 7.6 | 8.1 | 10.8 | 8.6 | 12.6 | .. | 13.7 | 7.5 | .. | 9.8 | |
Feb. 2.. | M. | 427 | 566 | 532 | 427 | 449 | 489 | 518 | 487 | 469 | ... | 487 | 430 | .. | 475 |
S.D. | 20 | 53 | 64 | 34 | 21 | 41 | 40 | 43 | 43 | .. | 43 | 45 | .. | 38.3 | |
C. | 4.7 | 9.4 | 12.0 | 8.0 | 4.7 | 8.4 | 7.7 | 8.8 | 9.2 | .. | 8.8 | 10.5 | .. | 8.0 | |
Low-diet av ....... | M. | 415 | 597 | 519 | 468 | 445 | 513 | 500 | 523 | 469 | 505 | 474 | 460 | .. | 486 |
S.D. | 33 | 49 | 59 | 42 | 32 | 44 | 52 | 50 | 60 | 48 | 52 | 39 | .. | 45.4 | |
C. | 7.9 | 8.1 | 11.3 | 9.0 | 7.2 | 8.8 | 10.5 | 9.5 | 12.8 | 9.3 | 10.8 | 8.5 | .. | 9.3 | |
Individual subjects show homogeneous averages from experiment to experiment. For example, with Kon, the reaction times range within 10 per cent of each other. They are, beginning at the first session with this subject (October 27) 550, 506, 514, 505, 506, 501, 540, 532 σ, with a total average of 519 σ and an average variability of 11 per cent. The results are compared in figure 113, in which curves for both squads and for all three factors of the table, that is, average reaction time, standard deviation, and coefficient of variability, are presented. Squad B shows decidedly more fluctuation from experiment to experiment in the average reaction time than is found with Squad A. They would seem to have done poorly in the first and second trials with this measurement as compared with Squad A, particularly so when it is considered that the data of Squad A, in comparison to that of Dodge and Benedict, show that these men were somewhat slow in these reactions. Squad B did poorly in their last normal experiment (January 5) and on the three low-diet dates made their best records, i. e., 468, 478, and 476. Squad A shows, on the contrary, uniform results up to and including December 19. The two sessions of January 12 and 26 are remarkably poor for this group, being almost at the same level as their first experiment on word reactions. On February 2 the men returned to the level of their December reaction averages.
1 Dodge and Benedict, Carnegie Inst. Wash. Pub. No. 232, 1915, p. 106.
2 Dodge and Benedict use mean variation and not standard deviation which is larger than the former (S. D. =1.253 M. V.). If the 8.0 per cent be multiplied by 1.25 to place it on the same basis with our coefficient of variability, we have 10 per cent to compare with 9.3 for the low-diet research.
Table 172. - Squad B - Time And Variability Of Word Reaction
[M. in σ S. D. in σ; and C. in per cent].
Date. | Reaction. | Fis. | Har. | How. | Ham. | McM. | Kim. | Lon. | Mac. | Sch. | Liv. | Sne. | Tho. | Van. | Wil. | Av. |
1917. | ||||||||||||||||
Nov. 3.. | M. | 629 | 531 | 559 | 569 | 751 | .. | 498 | 447 | .. | 561 | 537 | 535 | 606 | 451 | 548 |
S.D. | 62 | 44 | 89 | 78 | 103 | .. | 60 | 67 | .. | 61 | 75 | 82 | 81 | 57 | 68.9 | |
C. | 9.9 | 8.3 | 15.9 | 13.7 | 13.7 | .. | 12.0 | 15.0 | .. | 10.9 | 14.0 | 15.3 | 13.4 | 12.6 | 12.6 | |
Nov. 17.. | M. | 591 | 505 | 487 | 549 | 663 | .. | 461 | 395 | .. | 515 | 495 | 476 | 570 | 420 | 507 |
S.D. | 35 | 32 | 43 | 42 | 130 | .. | 48 | 40 | .. | 57 | 63 | 43 | 77 | 47 | 48.7 | |
C. | 5.9 | 6.3 | 8.8 | 7.6 | 19.6 | .. | 10.4 | 10.1 | ... | 11.1 | 12.7 | 9.0 | 13.5 | 11.2 | 9.7 | |
Dec. 15.. | M. | .. | 528 | 503 | 522 | 630 | .. | 433 | 423 | .. | 443 | 483 | 478 | 501 | 443 | 481 |
S.D. | .. | 43 | 40 | 62 | 55 | ... | 24 | 37 | .. | 44 | 48 | 51 | 47 | 33 | 43.6 | |
C. | .. | 8.2 | 8.0 | 11.9 | 8.7 | ... | 5.5 | 8.8 | 9.9 | 9.9 | 10.7 | 9.4 | 7.5 | 9.0 | ||
1918. | ||||||||||||||||
Jan. 5.. | M. | 544 | 473 | 472 | 537 | 575 | 634 | .. | .. | 610 | 515 | 492 | 501 | 500 | 423 | 496 |
S.D. | 34 | 36 | 34 | 53 | 41 | 82 | .. | .. | 66 | 44 | 55 | 45 | 34 | 49 | 42.7 | |
C. | 6.3 | 7.6 | 7.2 | 9.9 | 7.1 | 12.9 | .. | ... | 10.8 | 8.6 | 11.2 | 9.0 | 6.8 | 11.6 | 8.7 | |
Normal av. | M. | 588 | 509 | 505 | 544 | 655 | 634 | 464 | 422 | 610 | 509 | 502 | 498 | 544 | 434 | 508 |
S.D. | 44 | 39 | 52 | 59 | 82 | 82 | 44 | 48 | 66 | 52 | 60 | 55 | 60 | 47 | 51 | |
C. | 7.4 | 7.6 | 10.0 | 10.8 | 12.3 | 12.9 | 9.3 | 11.3 | 10.8 | 10.1 | 12.0 | 11.0 | 10.8 | 10.7 | 10.0 | |
Jan. 13.. | M. | 559 | 514 | 479 | 480 | .. | 542 | 443 | ... | 626 | 487 | 369 | 446 | 475 | 431 | 468 |
S.D. | 49 | 67 | 36 | 30 | .. | 51 | 38 | .. | 37 | 48 | 42 | 40 | 39 | 37 | 42.6 | |
C. | 8.8 | 13.0 | 7.5 | 6.3 | .. | 9.4 | 8.6 | .. | 5.9 | 9.9 | 11.4 | 9.0 | 8.2 | 8.6 | 9.1 | |
Jan. 19.. | M. | 558 | 528 | 478 | 487 | .. | 599 | 440 | .. | 618 | 487 | 419 | 457 ' | 496 | 427 | 478 |
S.D. | 54 | 43 | 39 | 32 | .. | 51 | 31 | .... | 21 | 39 | 57 | 31 | 56 | 29 | 41.1 | |
C. | 9.7 | 8.1 | 8.2 | 6.6 | ... | 8.5 | 7.0 | .. | 3.4 | 8.0 | 13.6 | 6.8 | 11.3 | 6.8 | 8.6 | |
Jan. 27.. | M. | 556 | 491 | 469 | 477 | .. | 502 | 429 | ..... | 602 | 483 | 470 | 457 | 490 | 440 | 476 |
S.D. | 53 | 27 | 31 | 34 | .. | 51 | 37 | .... | 47 | 38 | 63 | 44 | 37 | 33 | 39.7 | |
C. | 9.5 | 5.5 | 6.6 | 7.1 | .. | 10.2 | 8.6 | .. | 7.7 | 7.9 | 13.4 | 9.6 | 7.6 | 7.5 | 8.3 | |
Low-diet av ......... | M. | 558 | 511 | 475 | 481 | .. | 548 | 437 | ..... | 515 | 486 | 419 | 453 i | 487 | 433 | 474 |
S.D. | 52 | 46 | 35 | 32 | .. | 51 | 35 | .. | 35 | 42 | 54 | 38 | 44 | 33 | 411 | |
C. | 9.3 | 8.9 | 7.4 | 6.7 | .. | 9.4 | 8.1 | .. | 5.7 | 8.6 | 12.8 | 8.5 | 9.0 | 7.6 | 8.7 | |
The standard deviation was largest for both groups at their first session and fairly uniform beyond that, with the exception of a definite increase for Squad A on January 26. As shown in the lowest pair of curves, the standard deviation is about the same per cent of the average reaction time for both groups. The curves-run remarkably close together. As might be expected, the percentage variability was largest at the first, that is, on October 13 and November 3 for Squads A and B. After that it remained between 8 and 10 per cent.
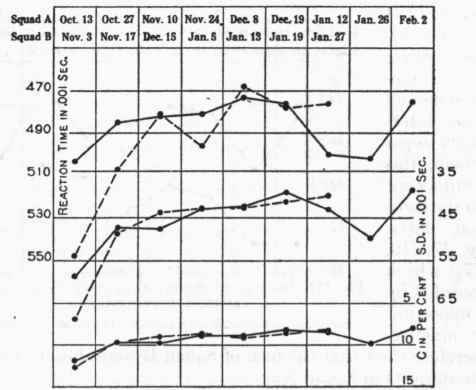
Fig. 113. - Word-reaction time and its variability. Solid lines represent Squad A, and broken lines Squad B.
The record for January 26 shows a depression. We conclude that the low-diet condition produced no definite change in the general group averages or in the variability of the latency in the word-reaction measurement. In general the results tended to be somewhat poorer following the Christmas vacation.
Continue to:
My Books

