Addition Of One-Place Numbers #2. Continued
Description
This section is from the book "Human Vitality And Efficiency Under Prolonged Restricted Diet", by Francis G.BENEDICT, Walter R. Miles, Paul Roth, And H. Monmouth Smith. Also available from Amazon: Human Vitality and Efficiency Under Prolonged Restricted Diet.
Addition Of One-Place Numbers #2. Continued
1This comparison is among the 10 regular subjects of each squad.
The results are compared directly in figure 105. The performance of each squad is represented by three curves: (1) total number of columns added in 10 minutes; (2) number of columns correctly added in 10 minutes; and (3) percentage of errors in the total number of columns added. In the case of the total number of columns both squads began at identically the same level. Squad A shows a rather smooth and gradual practice curve, with the exception of the points at November 10 and February 2. On the latter date evidently special effort was made. Squad B does not show so much improvement. The second session was slightly below the record of the first, but it must be recalled that the time interval elapsing was 1 month. At January 5 there is a distinct drop. This was apparently caused in largest part by the absence of subject Tho, the champion adder of the squad, who had been a bank clerk. Tho, because of transportation difficulties in returning from the Christmas vacation, was unable to reach the Laboratory on this evening until the group work had been completed. Squad B also reached their highest point on the last date, January 27. The two preceding dates for this squad, January 13 and 19, both of which were in the reduced-diet period, were not up to the level that would have been expected on the basis of the performance for December 15 and previously. The whole squad was present on January 13 and 19. One would therefore normally expect some increase over previous experiments. The fact that there was none may reasonably be charged to the low-diet conditions.
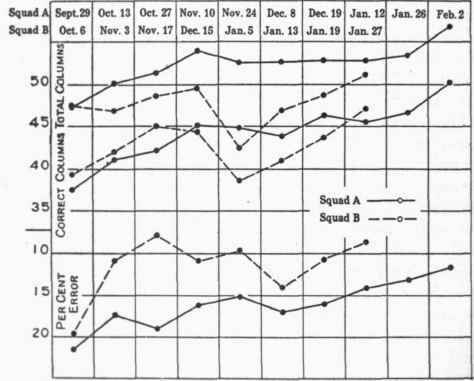
Fig. 105. - Average results in the 10-minute addition test.
The factor of accuracy entered into the second set of curves, showing the number of columns correctly added. There is a reversal in the first three sessions in this case, Squad B showing the better score. The two squads are very nearly equal at their fourth session. At the fifth session, Squad B was handicapped by the absence of Tho. In the sixth and seventh sessions they again show a poorer performance than would have been expected on the basis of their previous experience and records. On the last date they rallied, with a performance on the average two columns better than anything they had previously done. The curve for Squad A is fairly regular; there is a very slight decline in the fifth and sixth sessions as compared to the fourth, and in the eighth session as compared with the seventh, but these do not seem large enough to be of much significance. The curve is below that for Squad B during the first three sessions, including the normal of September 29.
In the percentage of errors the two squads differ widely. Although they began fairly near the same point, Squad A at 21.5 per cent and Squad B at 19.7 per cent, the distance between them becomes prominent in the next two experiments. It is also large in the fourth and fifth sessions. In the sixth for Squad B, which was their first during the low-diet period, they show a definite decline. There is some recovery in the seventh session, i. e., the second low-diet session, but the level reached is not what would be expected on the basis of their previous records. On the last date, even though there was some tendency to a spurt of unusual effort, they did not reach a level exceeding that which had previously been reached. The fact that the two squads began at almost the same level of errors, and that in the second, third, fourth, and fifth sessions Squad A did not make nearly so much improvement as Squad B, coupled with the fact that Squad B at the beginning of the reduced diet showed an increase in the percentage of error,1 makes it appear that the reduction in diet was not favorable to the highest possible performance in accurate work in intensive adding during a period of 10 minutes of continuous test.
Continue to:
My Books

