Body-Surface
Description
This section is from the book "Human Vitality And Efficiency Under Prolonged Restricted Diet", by Francis G.BENEDICT, Walter R. Miles, Paul Roth, And H. Monmouth Smith. Also available from Amazon: Human Vitality and Efficiency Under Prolonged Restricted Diet.
Body-Surface
The body-surface of the men in Squads A and B has been computed both from the photographs and from the Du Bois measurements. Finally, for further comparison we have drawn off the predicted surface areas from the height-weight chart. These values are given in tables 18 and 19. The method of computing the body-surface from the Du Bois measurements, also the factors used in the linear formula are shown in the typical series of measurements given in table 16. The method of computing the body-surfaces from the profile photographs is as follows:
Table 18. - Body-Surface Measured By Different Methods - Squad A
Subject. | Du Bois linear formula. | Du Bois height-weight chart. | Photographic (5.02 C). | ||||||
Sept. 29. | Nov. 24. | Feb. 2. | Sept. 29. | Nov. 24. | Feb. 2. | Sept. 29. | Nov. 24. | Feb. 2. | |
sq. m. | sq.m. | sq.m. | sq. m. | sq. m. | sq. m. | sq.m. | sq.m. | sq.m. | |
Bro....... | 1.69 | 1.62 | 1.61 | 1.70 | 1.61 | 1.62 | 1.71 | 1.58 | 1.55 |
Can....... | 2.03 | 1.87 | 1.86 | 1.97 | 1.87 | 1.87 | 1.99 | 1.83 | 1.87 |
Kon1...... | 1.83 | 1.75 | 1.72 | 1.78 | 1.74 | 1.71 | 1.80 | 1.80 | 1.69 |
Gar....... | 1.86 | 1.74 | 1.74 | 1.83 | 1.76 | 1.75 | 1.91 | 1.79 | 1.73 |
Gul....... | 1.81 | 1.71 | 1.72 | 1.75 | 1.67 | 1.69 | 1.76 | 1.66 | 1.63 |
Mon... | 1.88 | 1.76 | 1.78 | 1.81 | 1.72 | 1.72 | 1.84 | 1.74 | 1.72 |
Moy... | 1.79 | 1.70 | 1.68 | 1.77 | 1.69 | 1.71 | 1.80 | 1.72 | 1.66 |
Pea....... | 1.88 | 1.74 | 1.76 | 1.79 | 1.72 | 1.72 | 1.88 | 1.79 | 1.69 |
Pec....... | 1.84 | 1.74 | 1.74 | 1.75 | 1.70 | 1.70 | 1.79 | 1.76 | 1.66 |
Spe....... | 1.79 | 1.67 | 1.75 | 1.66 | .. | 1.78 | 1.66 | .... | |
Tom...... | 1.79 | 1.69 | 1.67 | 1.73 | 1.69 | 1.69 | 1.76 | 1.66 | 1.61 |
Vea........ | 1.84 | 1.72 | 1.75 | 1.80 | 1.73 | 1.72 | 1.89 | 1.69 | 1.68 |
1The first body-surface measurements with Kon were obtained October 27.
Table 19. - Rody-Surface Measured By Different Methods - Squad B
Subject. | Du Bois linear formula. | Du Bois height-weight chart. | Photographic (5.02 C). | |||
Jan. 5. | Jan. 27. | Jan. 5. | Jan. 27. | Jan. 5. | Jan. 27. | |
sq. m. | sq. m. | sq. m. | sq. m. | sq.m. | sq.m. | |
Fis....... | 1.93 | 1.86 | 1.92 | 1.88 | 1.91 | 1.79 |
Hit...... | 1.83 | 1.75 | 1.77 | 1.72 | 1.75 | 1.66 |
How...... | 1.95 | 1.85 | 1.89 | 1.83 | 1.88 | 1.77 |
Ham.......... | 1.97 | 1.94 | 1.96 | 1.92 | 1.89 | 1.89 |
Kim...... | 1.78 | 1.70 | 1.76 | 1.75 | 1.78 | 1.65 |
8ch....... | 1.84 | 1.78 | 1.77 | 1.71 | 1.75 | 1.71 |
Liv....... | 1.71 | 1.61 | 1.67 | 1.62 | 1.71 | 1.65 |
Sne....... | 1.90 | 1.77 | 1.88 | 1.82 | 1.82 | 1.77 |
Tho...... | 1.83 | 1.77 | 1.79 | 1.75 | 1.75 | 1.70 |
Van...... | 1.80 | 1.85 | 1.88 | 1.82 | 1.83 | 1.77 |
Wil....... | 1.66 | 1.58 | 1.65 | 1.62 | 1.58 | 1.59 |
From an extensive series of photographs and measurements of men and women it was found that when the planimetered area of a photograph giving a profile view of a subject with left arm extended1 was referred to a photographed meter scale, its relation to the total area of the body was represented by the average factor 5.02. In other words, the area of the planimetered section referred to the meter scale, when multiplied by 5.02, gave the total area of the body as computed by the Du Bois formula. Usually in planimeter-ing, the photograph is divided into two approximately equal parts by an arbitrarily drawn line passing through the hips. The upper and lower sections are then planimetered separately and the sum of the two areas, which on our instrument is expressed in square inches, is multiplied by the factor 6.45 for conversion to square centimeters. The length of the meter scale in the photograph is then found in millimeters and the true area of the surface shown in the photograph obtained by a simple proportion. Thus, using the photograph of Greyson C. Gardner (Gar, fig. 78) as an illustration, we found that the lower part of the body gave an area by planimetering of 1.78 square inches and for the upper part of 2.31 square inches, the total area of the photograph being 4.09 square inches. This, reduced to square centimeters by means of the factor 6.45, gave a total area for the photograph of 26.4 sq. cm., or 0.00264 sq. meter. The meter scale in the photograph measured 87.5 mm. or 0.0875 m. The proportion used for calculating the actual surface of the body shown in the photographs would therefore be: l2:12::a:x, I representing the length of the metric scale as photographed (0.0875 meter), a the area of the photograph expressed in square meters (0.00264 square meter), and x the actual surface area of the section of the body shown in the photograph.
1Our so-called "pose C." See Benedict. Am. Journ. Physiol., 1916. 41. p. 275.
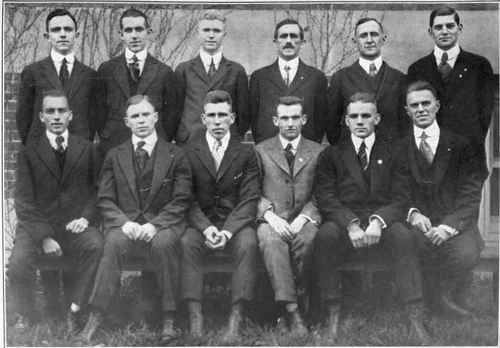
Fig. 86. - The Diet Squad (A), on November 25, 1917.
On this date the men were approximately at their minimum weight. Those standing are from left to right; Moyer, Veal, Tompkins, Peckham, Montague, Canfield. Sitting, from left to right: Brown, Gullickson, Kontner, Spencer, Peabody, Gardner.
The general equation would be: x=a/l2 The actual surface area of the section of Gar's body shown in the photograph would thus be 0.00264 sq. meter divided by 0.00766 or 0.345 sq. meter. Using the factor 5.02, which represents the relationship found to exist between the surface of the body shown in pose C and the surface of the whole body, we find that the body-surface of this subject as computed from the silhouette photograph is 1.73 sq. meters.1
With Squad A in September, when the first measurement was obtained, the surface areas as computed by the Du Bois formula are almost invariably higher than those found by the height-weight chart, while in November, at the time of the minimum weight, these differences practically disappear. We are somewhat at a loss to understand why there should be this variation, for the measurements were made with great care, although admittedly under considerable tension. The discrepancies are, however, not very great, but singularly enough lie almost invariably in one direction. When the values computed from the Du Bois formula from the set of measurements made on February 2 are compared with those calculated from the height-weight chart, we find a very close agreement for practically all of the subjects. The widest discrepancy is that with Mon, the values being 1.78 sq. meters for the Du Bois formula as compared with 1.72 sq. meters found with the height-weight chart. It is further noticeable that the differences are plus or minus, that is, the averages of the two areas for the squad as a whole would be nearly the same, irrespective of whether it was determined by the Du Bois linear formula or by the height-weight chart.
With Squad B a comparison between the results obtained with the Du Bois linear formula and the height-weight chart shows, for the most part, excellent agreement. For the measurements taken January 5, i. e., before weight-reduction, the widest difference is found with Sch, the values being 1.84 sq. meters for the Du Bois formula as against 1.77 sq. meters for the height-weight chart. With the measurements taken after the reduction in weight (January 27), there is likewise fairly uniform agreement between the results obtained on the two bases of measurement. Sch again shows the greatest discrepancy, with 1.78 sq. meters for the Du Bois formula, as opposed to 1.71 sq. meters for the height-weight chart. In these later comparisons, however, the variations are plus or minus, leaving no difference between the average areas for the whole squad when measured by either method, while on January 5 there was a tendency, as with Squad A at the beginning of the experiment, for the linear formula to give slightly higher values than with the height-weight chart.
Continue to:
My Books

