Efficiency In Performing Certain Clerical Tasks #2. Continued
Description
This section is from the book "Human Vitality And Efficiency Under Prolonged Restricted Diet", by Francis G.BENEDICT, Walter R. Miles, Paul Roth, And H. Monmouth Smith. Also available from Amazon: Human Vitality and Efficiency Under Prolonged Restricted Diet.
Efficiency In Performing Certain Clerical Tasks #2. Continued
Considerable improvement may be expected in successive performances of this kind of task. A comparison of the low-diet averages shown at the bottom of table 189 with the figures for September 29, which have just been considered, reveals the fact that the improvement was marked. The average for the 9 sessions, October 13 to February 2, inclusive, show total time results ranging from 384 with Pea, to 725 seconds with Pec, who was noted to be the slowest on September 29; the average for the 10 men was 500 seconds, a reduction in time of about 25 per cent from the first trial. The range for the total number of points made in the test had become smaller, being 71 to 95. It could hardly be expected that any subject would make absolutely perfect records throughout. Bro, who made 100 points on September 29, did so only two other times out of the nine following experimental sessions. The average number of points for the squad during the reduction period was 83.2, a gain of about 10 per cent. The number of points per minute ranged from 6.3 with Pec to 13.3 with Pea, with an average of 11.1, representing a gain of approximately 60 per cent.
Squad B (see table 190) in their first experiment with this test (October 6) averaged a longer time to complete the tasks, requiring 860 seconds as compared to 686 seconds for Squad A. Their total average score was, however, 10 points better than that of Squad A, 84.6 compared to 74.6 points. Their combined score in points per minute, due to the longer time required to fill out the blank, was 0.9 lower, i. e., 6.11 as compared with 6.99 points for Squads B and A. In the averages for the 5 normal sessions and for the 3 low-diet dates, Squad B shows less efficiency than Squad A in the performance of this test.
The comparison in points per minute for the 10 men in each squad and for the successive experiments is conveniently shown in figure 123. The chief characteristic of these curves is the rapid improvement; the irregularities are no larger than those commonly shown with such measurements. Squad B presents a rapid and uninterrupted improvement in the first four experiments; the depression on January 5 is coincident with the return from the Christmas vacation and also consistent with the findings in several of the other measurements for this date. During the low-diet period, Squad B continued to make improvement but very slightly. The change from 7.0 of September 29 to 8.6 of October 13 with Squad A is found to be not quite so large as the percentage change made by Squad B between their first and second experiments. It must be noted, moreover, that in the case of Squad B, the two experiments were separated by 4 weeks instead of 2 weeks, as with A. The depression on October 27 is caused in part by the poor records of Mon for time and for accuracy. (See table 189, which shows Mon's records on this date were for time, 1,355 seconds, total number of points, 51, and points per minute, 2.3.) If this subject were omitted from the average, the figure would be 8.2 points per minute, which would be much more nearly in line with the value shown for October 13, but slightly lower. Improvement is very rapid in the next three sessions, reaching its maximum on December 8. This maximum is largely due, perhaps, to the fortunate circumstance that on that date three of the subjects, Bro, Gar, and Vea, chanced to have perfect records, with the result that their points per minute were in each case the highest they had made at any time in the experiments. Giving their records in order as named, they were 16.3,14.2, and 16.9 points per minute. The marked depression on December 19 can not be associated with any particular dietetic change, for the men were fairly comfortable at this period of the experiment, as is clearly indicated by their introspections recorded in other sections of this report. The improvement was continued on January 12, 26, and February 2, although not on the high level of December 8. The results, as with several other of our measurements, are complicated. They indicate that Squad B during the three weeks of low diet, and Squad A during the first four weeks of low diet, improved but slowly in their efficiency in the clerical tests.
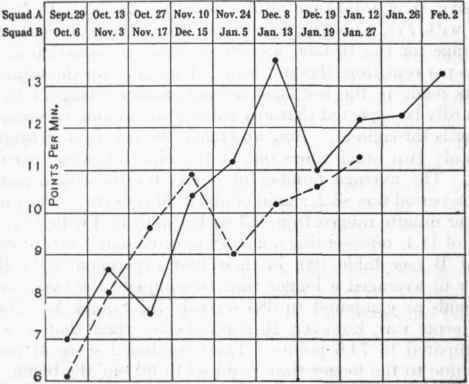
Fig. 123. - Accuracy in performing the clerical tasks. Solid lines represent Squad A, broken lines Squad B.
Continue to:
My Books

