Latency, Amplitude. And Refractory Period Of Patellar Reflex. Part 2
Description
This section is from the book "Human Vitality And Efficiency Under Prolonged Restricted Diet", by Francis G.BENEDICT, Walter R. Miles, Paul Roth, And H. Monmouth Smith. Also available from Amazon: Human Vitality and Efficiency Under Prolonged Restricted Diet.
Latency, Amplitude. And Refractory Period Of Patellar Reflex. Part 2
In attempting to use the patellar reflex in this low-diet investigation we recognize these elements of difficulty in making the measurements uniform and in interpreting the data. However, in conformity with our general purpose of providing as many opportunities as possible for the unknown effect of a prolonged reduced diet to demonstrate itself in the neuro-muscular processes, and since it was not convenient to use other reflex measurements, we have employed it here. The results are rather disappointing in the sense that the data (see tables 165 and 166) appear to be so fragmentary. Of the menibers of Squad A the patellar reflex could never be secured from Pea; it was always very small or absent with Pec and Bro, and was exceedingly irregular with Tom. Fre served but a short time, and Spe was ill from December 19 to the end of the experiment. Gar showed a peculiar elastic vibration of the muscle which greatly complicated the curves and made many of them illegible and other readings untrustworthy. The averages in the extreme right-hand column of table 165 are from the 6 subjects, Can, Kon, Gul, Mon, Moy, and Vea, with whom reasonably complete records were obtained. Even with these there were a number of breaks. The one with Kon on October 13, was due to his coming into Squad A late, as explained on page 557. Opposite each date, and in the vertical column, the average values for latency, amplitude, and separation of stimuli are recorded for each subject. The average for the 6 men for September 29 shows 34 σ for latency, 22 mm. for:
1Dodge, Zeitschr. f. allg. Physiol., 1910, 12, p. 27. It would appear that Professor Dodge's statement "I believe the amplitude of the response in the knee jerk should be used with extreme caution as an indicator of the variations of any one selected factor; slight variations in the mean should be viewed with especial distrust," is thoroughly justifiable.
2Dodge and Benedict and later Miles worked with a separation of 0.5 second. The secondary reflexes under these conditions were usually of considerably less amplitude than the primary reflexes, but the reflex arc was never totally refractory with this separation between the stimuli.
3It is rather unfortunate that in the form Dodge and Benedict (see Carnegie Inst. Wash. Pub. No. 232, 1915, p. 49, ff.) published their data the values for latency and for reflex amplitude were not given directly, but only the differences between successive series of such measurements; comparisons can not therefore be made.
Table 165. - Squad A - Patellar Reflex Latency, Amplitude, And Refractory Period*
Date. | Reflex. | Bro. | Can. | Kon. | Gar. | Gul. | Mon. | Moy. | Pea. | Pec. | Spe. | Tom. | Vea. | Fre. | Av. |
1917 | |||||||||||||||
Sept. 29........ | L. | 50 | 37 | 32 | 38 | 35 | 30 | 30 | (1) | 55 | 40 | 32 | 37 | 34 | 34 |
A. | 3.7 | 23 | 31 | 10 | 9 | 30 | 25 | .... | 4 | 19 | 19 | 14 | 33 | 22 | |
S. | 12 | 20 | (1) | 13 | 15 | (4) | 19 | ... | 30 | 26 | 28 | 14 | 24 | 17 | |
Oct. 13........ | L. | 50 | 43 | .. | 44 | 34 | 35 | 44 | (1) | (1) | 46 | 45 | 54 | 35 | 42 |
A. | 5.0 | 22 | .. | 8 | 10 | 30 | 8 | .... | ..... | 12 | 12 | 4 | 24 | 15 | |
S. | 12 | 21 | .. | 50 | 26 | 27 | 23 | .... | ..... | 40 | 29 | (3) | (4) | 24 | |
Oct. 27........ | L. | 40 | 42 | 36 | 32 | 35 | 35 | 43 | (1) | (1) | 33 | 38 | 36 | .... | 38 |
A. | 11 | 11 | 17 | 8 | 13 | 19 | 3 | .... | ..... | 11 | 3 | 13 | .. | 13 | |
s. | 21 | 19 | 28 | 26 | 24 | 37 | 22 | .... | ...... | 44 | (2) | (3) | ..... | 26 | |
Nov. 10........ | L. | 44 | 45 | 37 | 42 | 34 | 36 | 41 | (1) | (1) | 34 | (1) | 32 | ..... | 38 |
A. | 4 | 15 | 14 | 3 | 23 | 19 | 3 | ..... | ...... | 18 | ...... | 18 | *..... | 15 | |
S. | 18 | 20 | 26 | 37 | 27 | 0 | 39 | ... | ..... | 42 | ...... | 711 | ...... | 25 | |
Nov. 24........ | L. | (1) | 44 | 35 | 39 | 32 | 33 | 39 | (1) | (1) | 35 | (1) | 34 | .. | 36 |
A. | .... | 15 | 22 | 7 | 19 | 25 | 5 | ..... | .... | 12 | ..... | 14 | ... | 17 | |
S. | .... | 26 | 0 | 24 | 21 | 0 | 0 | .... | ..... | 37 | ...... | (3) | .... | 24 | |
Dec. 8........ | L. | (1) | 40 | 36 | 40 | 33 | 29 | 38 | (1) | (1) | 38 | (1) | 30 | .... | 34 |
A. | .... | 26 | 20 | 6.2 | 15 | 26 | 8.8 | .... | ..... | 7 | ...... | 24 | • • • • | 20 | |
S | .... | 31 | 25 | (1) | 0 | 38 | 36 | ..... | ...... | (6) | ...... | (3) | .... | 3? | |
Dec. 19........ | L. | 42 | 36 | 39 | (1) | 32 | 35 | 37 | (1) | (1) | ..... | (1) | 30 | ... | 35 |
A. | 2.6 | 19 | 12 | 21 | 18 | 12 | ..... | ..... | ...... | ...... | 19 | .... | 17 | ||
S. | (4) | 14 | 20 | (3) | 19 | 29 | 25 | ..... | ..... | ..... | ..... | 329 | ...... | 23 | |
1918 | |||||||||||||||
Jan. 12........ | L. | 47 | 42 | 31 | 38 | 37 | 37 | 40 | (1) | (1) | ...... | 32 | 36 | ..... | 37 |
A. | 4.5 | 21 | 28 | 3 | 6.8 | 17 | 6.3 | .... | ..... | ...... | 27 | 16 | ..... | 16 | |
S | (2) | 37 | 19 | (3) | 312 | 37 | 0 | ..... | ..... | ..... | 34 | (3) | ..... | 26 | |
Jan. 26........ | L. | (1) | 41 | 35 | (5) | 34 | 31 | 44 | (1) | (1) | ..... | 36 | 46 | ..... | 39 |
A. | .... | 23 | 14 | 12 | 30 | 6 6 | ...... | .... | ..... | 10 | 7.4 | ..... | 16 | ||
8. | .... | 23 | 20 | (3) | 20 | 30 | ?6 | ..... | .... | ..... | 24 | (3) | ..... | 25 | |
Feb. 2........ | L. | 44 | 35 | 38 | 39 | 34 | 31 | 34 | (1) | (1) | ..... | (1) | 41 | .. | 36 |
A. | 2.2 | 31 | 12 | 3.5 | 11 | 32 | 13 | ..... | .... | ..... | ..... | 9.2 | ... | 18 | |
S | (2) | 22 | 17 | (3) | 326 | 35 | 26 | .... | ..... | ..... | ..... | (3) | .. | 25 | |
*L., A., and 8. designate latency in 0.001 "(σ), amplitude, in mm., and separation in 0.01". In the body of the table the index figures refer to the following notes: 1No reflexes. 5llegible.
2No failures with short 8.; all very small. 6Irregular voluntary contraction following priamplitude, and 0.17 second for separation, i. e., refractory period. These values are in the same range as those mentioned for the series of 1917, which were 32 σ, 15 mm., and 0.25 second. The individual subjects do not show extraordinary variation among themselves or with any individual from date to date.
3Summation evident. mary reflex.
4Second contact out of order. 7Leg feels tighter against apparatus.
In the case of Squad B there were only 4 men, Fis, Har, Sne, and Tho, with whom the patellar reflex was usually present in measurable amplitude and whose records are reasonably complete for the series of experiments. On the first date, October 6, these four show averages of 37 σ for latency, 23 mm. for amplitude, and 0.18 second for refractory period separation. All of the values, considering the process under discussion, are in reasonable agreement with the previous values which have been mentioned as possible standards.
Table 166. - Squad B - Patellar Reflex Latency, Amplitude, And Refractory Period*
Date. | Reflex. | Fis. | Har. | How. | Ham. | McM. | Kim. | Lou. | Mac. | Sch. | Liv. | Sne. | Tho. | Van. | Wil. | Av. |
1917. | ||||||||||||||||
Oct. 6... | L. | 39 | 36 | 40 | 42 | .. | .. | 39 | 36 | • • • | 34 | 37 | 35 | 51 | 44 | 37 |
A. | 15 | 19 | 14 | 5 | .. | .. | 4 | 32 | .. | 5 | 19 | 39 | 3 | 5 | 23 | |
S. | 18 | (4) | 19 | (4) | .. | .. | (1) | 20 | • • | (2) | 13 | 24 | 24 | (4) | 18 | |
Nov. 3... | L. | 41 | 39 | 53 | 38 | 44 | • • | (1) | 26 | . . . . | 44 | 37 | 32 | 40 | 38 | 37 |
A. | 6.8 | 11 | 1 | 4 | 6 | .. | 30 | . . • . | 2 | 23 | 39 | 18 | 3 | 20 | ||
S. | 18 | 18 | (2) | 24 | (2) | .. | 28 | .. | (2) | 15 | 23 | 317 | 19 | 18 | ||
Nov. 17... | L. | 51 | 37 | 50 | (1) | 45 | .. | (1) | 33 | • • • | (1) | 39 | 48 | 45 | (1) | 44 |
A. | 4 | 18 | 5 | 5 | ... | 18 | .. | 21 | 5 | 3 | .. | 12 | ||||
S. | 19 | 24 | (1) | 49 | .. | 35 | .. | .. | 19 | 25 | 20 | .. | 22 | |||
Dec. 15... | L. | • • | 38 | (1) | 39 | (1) | • • • | (1) | 34 | • • | (1) | 36 | 34 | (1) | (1) | 36 |
A. | • . • | 7.9 | 3.5 | ... | .... | .. | 30 | .. | .. | 22 | 21 | 17 | ||||
S. | • • • • | 15 | • • • | (2) | ... | .. | .. | 26 | .. | .. | 15 | 25 | .. | .. | 18 | |
1918. | ||||||||||||||||
Jan. 5... | L. | 34 | 32 | 43 | (1) | (1) | 39 | .. | .. | (1) | (1) | 37 | 36 | 39 | 38 | 35 |
A. | 20 | 18 | 3 | .. | .. | 12 | .. | .. | .. | .. | 20 | 36 | 5 | 4 5 | 23 | |
S. | 20 | 13 | (2) | .. | ... | 19 | .. | .. | .. | .. | 16 | 25 | 12 | 13 | 18 | |
Jan. 13... | L. | 37 | 39 | 44 | (1) | .. | (1) | (1) | .. | (1) | (1) | 36 | 38 | 39 | (1) | 37 |
A. | 10 | 7.3 | 7.4 | .. | ... | .. | .. | .. | .. | 25 | 26 | 3 | .. | 17 | ||
S. | 15 | 321 | 12 | .. | .. | .. | .. | .. | .. | .. | 18 | 25 | 33 | ... | 20 | |
Jan. 19... | L. | 36 | 42 | (1) | (1) | .. | (1) | (1) | ___ | (1) | (1) | 38 | 39 | (1) | (1) | 39 |
A. | 4.6 | 3.6 | .. | .. | .. | .. | .. | .. | .. | .. | 23 | 12 | .. | .. | 11 | |
S. | (2) | (2) | .. | .. | .. | .. | .. | .. | .. | 13 | 18 | .. | ... | 15 | ||
Jan. 27... | L. | 42 | 38 | 46 | (1) | .. | (1) | (1) | (1) | (1) | 38 | 40 | (1) | (1) | 39 | |
A. | 5.8 | 4.2 | 3.8 | .. | .. | .. | .. | .. | .. | .. | 20 | 12 | .. | .. | 10 | |
S. | 37 | (3) | (2) | ... | .. | .. | .. | ... | .. | .. | 313 | 24 | ... | .. | 25 | |
*L., A., and S. designate latency in 0.001 second (σ), amplitude in millimeters, and separation in 0.01 second. In the body of the table the index figures refer to the following notes: 1No reflexes. 3Summation evident.
2No failures with short S.; all very small. 4Second contact out of order.
It will be more convenient to compare the results with the two squads under conditions of normal eating and reduced diet from the plotted values in figure 111. The solid lines are for Squad A, the broken lines for Squad B. The two curves at the top of the figure give the latency. Beginning with 34 σ on September 29, Squad A in their second experiment showed a reflex time lengthened to 42 σ. The latency was also longer than normal in the next three experiments, October 27, November 10, and November 24. On December 8 it was the same value as the normal, but on the succeeding four dates it was longer, conspicuously so on January 26. Squad B began with a longer latency than A. The first two experiments separated by 1 month show the same latency, 37 σ. At the next date this was lengthened to 44 σ, a rather conspicuous and unaccountable change.1 On December 15 and January 5 the latency was slightly shorter than on the previous days, October 6 and November 3. On January 13 it was at the initial level, that is, 37 σ. This was the first low-diet date. On the next two, January 19 and 27, the latency was longer than at any other point save November 17.
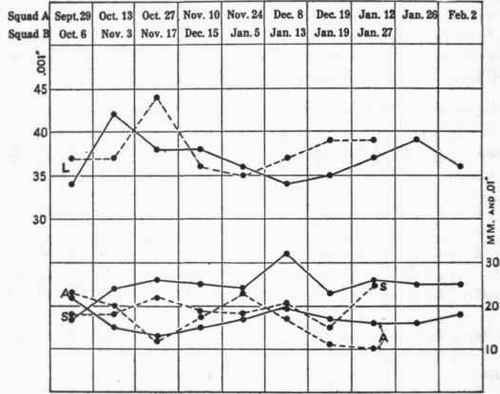
Fig. 111. - Patellar reflex averages.
L, latency; A, amplitude, and S, refractory period separation. The scale at the left is for 0.001 second, that at the right is for millimeters in the case of A and for 0.01 second for S. Solid lines represent Squad A, and broken lines Squad B.
The curves for the amplitude of the reflexes tend in each case to be the complement of those for the latency. When the latency is long the amplitude is small, and vice versa. Squad A shows a decrease in the amplitude for October 13, 27, and November 10. This accompanied the increase in latency. Squad B likewise shows a decrease in amplitude on November 17 with their associated latency of 44 σ, but the amplitude was still smaller on the last two low-diet dates, January 19 and 27. The refractory period (S) increases after the one normal date, September 29, with Squad A. It is unusually long on December 8. Otherwise it is fairly uniform throughout the low diet sessions, and is usually about 0.25 second. In the case of the four men of Squad B with whom data could be secured there seems no significant change until the very last date, January 27. This was on low diet, but it must be noted to the contrary that the previous date, January 19, which was also during the low-diet period, shows the shortest refractory interval found with these men, but this average was for only two subjects, Sne and Tho.
1See discussion of November 18 in relation to speed of eye movements, page 621.
The footnotes in tables 165 and 166 indicate a large number of cases in which the tendency to summation of stimuli was present, i. e., the production of one reflex for the two blows. This phenomenon of summation was found in only two cases with the normal series of 1917; it was not found with any of the 26 men of Squads A and B in the first measurement of the patellar reflex, and appeared only once (with Van, November 3, table 166) during normal dietetic conditions. With the reduced diet it was rather frequent (see Har, January 13 and 27, Sne, January 27, for Squad B, and many other illustrations with Squad A). When the summation of the two stimuli produced but one reflex it is of course impossible to give a figure for the refractory period. That stimuli of 100-gram hammers falling through 90°, which are normally rather intense stimuli for the patellar reflex, should become to the reflex as subliminal stimuli and only be effective when two of them succeed each other by a short interval demonstrates the fact that conditions exist in which the reflex irritability has become definitely less than normal. Whether this is primarily due to the reduced diet can not be absolutely proved from these data. The change may be in part from adaptation to the form of stimuli.
The evidence for the effect of the reduced diet upon the patellar reflex as a neuro-muscular measurement is not uncomplicated. It is our opinion, however, that there was a tendency for the reflex to be less irritable when the subjects were on the reduced diet.
Continue to:
My Books

