Pulse Records At Meal Times. Continued
Description
This section is from the book "Human Vitality And Efficiency Under Prolonged Restricted Diet", by Francis G.BENEDICT, Walter R. Miles, Paul Roth, And H. Monmouth Smith. Also available from Amazon: Human Vitality and Efficiency Under Prolonged Restricted Diet.
Pulse Records At Meal Times. Continued
Pulse Records At Meal Times, Squad B
The pulse data taken at meal times for Squad B in this series have a significance not found with those for Squad A, as with the second squad the counts were made with both normal and low diet. It is unnecessary here to give in detail the individual measurements reported by Mr. Davis, but the differences between the pulse values during October, November, and December and those for the January period have a special interest, as those for the first three months were obtained under normal diet conditions, while most of those recorded in January were with the low diet. With Squad B pulse counts were made not only at the noon and night meals, but likewise during the morning meals, and hence a direct comparison may be made of the morning, noon and night values. This comparison is made in table 92. Inasmuch as the subjects were on normal diet until January 8, we find a reasonable uniformity in the values. The normal morning pulse-rate averaged 63, the noon pulse 72, and the night 68. With the beginning of the reduced diet, however, a noticeable fall in the pulse-rate is found with the entire group, and the three average values recorded beginning January 8 are on a definitely lower level than any of the earlier records. The average for the morning records during the low-diet period from January 8 to 28 was 56 beats, or 7 beats lower than with full diet. The noon average with reduced diet was 61 beats, or 11 beats lower than with the normal diet. At night the rate was lower than at noon, being 68 on normal diet and 58 on restricted diet with a difference of 10 beats. With Squad A the reverse was found, the evening rate being higher than that recorded at noon. This may in part be explained by the fact that the members of Squad A took their physical exercise between 3h30m and 5 o'clock in the afternoon while most of the men in Squad B took theirs in the morning; hence the after-effect of muscular activity may have influenced the pulse-rates.
Table 92. - Average Pulse Records At Morning, Noon, And Evening Meals - Squad B.1
Morning. | Noon. | Night. | |
Oct. 19 to 31...... | 63 | 73 | 66 |
Nov. 1 to 15...... | 63 | 74 | 68 |
Nov. 16 to 30..... | 63 | 72 | 68 |
Dec. 1 to 12....... | 63 | 70 | 68 |
Dec. 13 to 19...... | 63 | 70 | 69 |
Dec. 20 to 312 | 63 | 72 | 70 |
Morning. | Noon. | Night. | |
Jan. 1- to 7... | 62 | 70 | 66 |
Jan. 8 to 12........ | 359 | 365 | 261 |
Jan. 13 to 20....... | 357 | 362 | 357 |
Jan. 21 to 28....... | 353 | 357 | 355 |
Jan. 29 to Feb. 24. . | 64 | 70 | 72 |
1 Only 8 men included in these averages. 2 Records for only four men.
3 With reduced diet.
4 Records for only two men; unrestricted diet.
In the post-diet period we have observations for but two men. These show the characteristic rise in pulse-rate which is likewise observed with Squad A in the post-diet values obtained prior to bicycle riding. (See p. 397.) The general picture, therefore, presented by Squad B is in full conformity with that shown by Squad A and in addition we have a very clear picture of the normality of the pulse-rate taken under conditions obtaining in Mr. Davis's counts.
While these sitting pulse-rates of Squads A and B counted by the subjects themselves under considerable psychical, digestive, and slight muscular activity can not have the significance of careful records during complete repose, they contribute important confirmatory evidence as to the depressing effect of the reduced diet upon the heart rate.
Pulse Curves For Squad A
To give an indication of the general influence of the reduced diet upon the pulse-rate of the men in Squad A as observed in the series discussed in the previous sections, we have plotted the average values and give these curves in figure 91. The values plotted include: (1) the averages obtained for the basal pulse in the early morning, with the subject in the post-absorptive condition, without previous activity, and in the lying position; (2) the averages secured by Professor Johnson immediately before work with the subject in the lying position but not in the postr-absorptive condition; (3) those obtained by the subjects on themselves in the sitting position at the noon meal, and (4) in the same position at the evening meal.
An examination of these curves shows that the basal pulse falls to a minimum about the middle of November, with a tendency thereafter to a slight rise to a somewhat higher level during December. On the return of the men from the Christmas vacation the pulse-rates begin at a higher level, with thereafter a distinct fall. The data obtained by Professor Johnson, which are plotted in the dotted line, follow with great regularity the course of the basal pulse obtained in the morning and show a reasonably constant difference in level between the two conditions under which the pulse was counted. The striking increases in pulse-rate in the post-diet period are very clearly shown in this curve for Professor Johnson's data. The self-counts by the subjects at the noon and evening meals are very irregular, as would be expected. Both curves fall somewhat together in their general trend and approximate more or less the general form of the two lower curves for the values obtained in the early morning and prior to work. From an analysis of Mr. Davis's figures we find that the average pulse as shown for the counts made at the noon meal is 57, and that for the evening meal 60, thus showing a slightly higher pulse at night. This is borne out in general by the course of the two curves, although the irregularities and intersections of the two records are so great that it is difficult to draw any quantitative estimate from them. A general conclusion may be drawn, however, that the pulse-rate, under conditions of food in the stomach and moderate activity, undergoes a striking change with a reduction in diet which is in conformity with the basal values obtained with the subject in the lying position. It is to be regretted that more data were not obtained previous to the diet restriction and in the post-diet period, but the curves obtained show clearly that the diet restriction had a profound influence upon the pulse-rate of the entire group of 12 men.
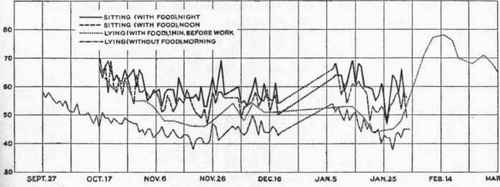
Fig. 91. - Pulse-rate curves for sitting and lying positions and at different times of day - Squad A.
Continue to:
My Books

