Transition Pulse
Description
This section is from the book "Human Vitality And Efficiency Under Prolonged Restricted Diet", by Francis G.BENEDICT, Walter R. Miles, Paul Roth, And H. Monmouth Smith. Also available from Amazon: Human Vitality and Efficiency Under Prolonged Restricted Diet.
Transition Pulse
At the time of the treadmill experiments of January 28 and February 3, described on page 440, continuous electrocardiograms were taken on each subject during 15 seconds of standing and the immediately succeeding 60 seconds at the beginning of walking, and then again during the last 15 seconds of walking and the following 30 seconds of standing. The data thus obtained show the changes in duration of the pulse cycles as the pulse-rate alters during the successive seconds of walking or of standing. They also show how quickly the heart reacts to the stimulus and at which cycle the pulse has reached its maximum rate. We have termed these measurements the transition pulse as they were taken during the time that the heart was adjusting itself to the altered demands made upon it by the changed conditions of either walking or standing.
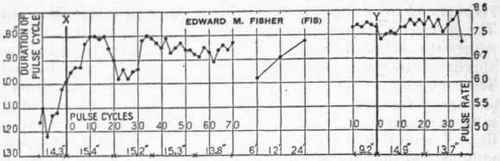
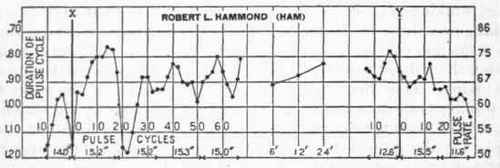
These measurements can best be presented graphically. Figures 95, 96, and 97 give the curves representing the transition pulse of the individual members of Squad B on January 28, 1918, and figures 98, 99, and 100 show those for Squad A on February 3, 1918. Since the measurements of the transition pulse were first made on January 28, there are no basal data for any of these subjects, i. e., no data taken when the men were living on a normal diet. To supply this lack of basal material, five members of the Laboratory staff went through the walking routine in the post-absorptive condition during the week of February 14 to 19, 1918, records being made of their transition pulse. The curves for these normal subjects appear in figure 101. In these figures the durations of the pulse cycles, calculated in 0.01 seconds, appear as ordinates. The abscissae show the number of pulse cycles. The curves have been drawn so that each plotted point represents the average of two cycles, thus diminishing the small variations present in the normal heart action and producing a smoother curve. The heavy lines X and Y indicate the moment of transition from standing to walking and the reverse. The pulse cycles to the left of X represent the preliminary standing period. Those to the right of X represent the initial walking period. Similarly, the cycles to the left of Y are for walking and those to the right of Y are for standing. Between these two transition curves, there has also been inserted a short curve representing the pulse-rate at the sixth, twelfth, and twenty-fourth minutes of walking. Thus there are shown for each subject (1) the curve for the walking transition following standing; (2) the curve for the standing transition following walking; and (3) a curve for the pulse-rate at three points, usually after 6, 12, and 24 minutes of walking. The approximate pulse-rate corresponding to the length of pulse cycle is given on the right of the figure. Intervals of approximately 15 seconds are shown by the smaller figures at the bottom of each transition curve. The sixth, twelfth, and twenty-fourth minutes are also indicated on this line for the intervening walking curve, but it should be clearly understood that the times between these points, as represented by the abscissae, are not uniform. For instance, with Fis, the time covered by the preliminary standing pulse record was 14.3 seconds. The first twenty cycles of walking lasted 15.4 seconds, while the entire walking portion of this transition record was 59.7 seconds. There is then an interval of slightly over 5 minutes before the pulse-rate for the sixth minute, and intervals of 6 and 12 minutes between the next two points. After the twenty-fourth minute, there is an elapsed period of approximately 2 minutes before standing began at Y. The ten pulse cycles of walking preceding the standing lasted 9.2 seconds, while the standing record was 28.6 seconds.
Transition Pulse, Squad B
It is hardly necessary to analyze each individual curve shown in the succeeding figures. The chief points of resemblance and difference can be brought out by considering a few curves from each group. In the pulse of Fis shown in figure 95, the average length of the first two pulse cycles noted was 1.16 seconds. The average of the next two pulse cycles was 1.10 seconds, after which the duration changed to 1.22 seconds for the average of the fifth and sixth cycles. From this point the duration of the pulse cycles shortened, and at the transition, X, the length was 0.99 second. The shortening of the duration of the cycle continued until the tenth cycle after walking started, which was 0.80 second; it then remained practically constant through the sixteenth beat, after which the duration began to lengthen again and continued lengthening until the twenty-second cycle. There followed, then, a period of some slight variations up to the thirtieth beat, after which a second period of quickened pulse - i. e., shorter duration of pulse cycle - set in and by the time of the thirty-fourth cycle it had returned to the value observed at the tenth cycle. This corresponds approximately to 29 seconds after the walking started. From this point there was a gradual lengthening of the pulse cycle to the close of the record. The last cycle of the transition period corresponds to a duration of 0.83 second, which was after 59.7 seconds of walking. The pulse-rates taken for the sixth, twelfth, and twenty-fourth minutes of the succeeding interval of walking appear here as a short curve and show, in a general way, the relation of the pulse to the transitional rate as the period progressed. It is seen in the final portion of the figure that the duration of the pulse cycle was nearly uniform for the 10 cycles preceding the close of walking, and was 0.77 second at the moment of transition. The average of the first two pulse cycles of the standing period shows an immediate lengthening to 0.82 second, when again a period of shortening rate followed, which was maintained, more or less irregularly, for 34 beats during the next 27 seconds.

Continue to:
My Books

