The Regulation Of Temperature. Part 4
Description
This section is from the book "The Elements Of The Science Of Nutrition", by Graham Lusk. Also available from Amazon: The Elements of the Science of Nutrition.
The Regulation Of Temperature. Part 4
The following table presents the results of work upon those persons whose surface areas were actually measured:
Comparison Of Area Of Body In Square Meters As Actually Measured With That Calculated From The Du Bois Formula
Person. | Area. Measured. | Area Calculated. | Error in Du Bois Formula. | Error with Meeh's Formula. | Age. | Weight. | Height. | Basal Calories per Sq. M. Surface per Hour. | Remarks. |
Men: | Sq. M. | Sq. M. | % | % | Years. | Kg. | Cm. | ||
Benny I ..... | 0.8473 | 0.8512 | +0.5 | +21 | 36 | 24.2 | 110.3 | 330 | A cretin. |
Morris S...... | 1.6720 | 1.6938 | +1.3 | +17 | 21 | 64.0 | 164.3 | 41.2 | Normal. |
R. H. H...... | 1.8375 | 1.7680 | -3.8 | + 7 | 22 | 64.1 | 178.0 | 40.9 | Normal. |
E. F. D. B.... | 1.0000 | 1.8832 | +0.9 | +14 | 32 | 74.0 | 179.2 | 39.8 | Normal. |
Gerald S...... | 1.4901 | 1.4941 | +0.3 | + 4.9 | 17 | 45.2 | 171.8 | 36.7 | Diabetes. |
R.H.S...... | 1.7981 | 1.7995 | +0.1 | + 8.4 | 21 | 63.0 | 184.2 | 37.4 | Normal. |
Fabian S .... | 1.1869 | 1.1455 | -3.5 | + 6.2 | 12 | 32.7 | 141.5 | ||
R. L. (Legless) | 1.4299 | 1.4692 | +2.7 | +37.0 | 43 | 63.8 | |||
Women: | |||||||||
Mrs. McK.... | 1.8592 | 1.8956 | +2.0 | +36 | 48 | 93.0 | 149.7 | 37.9 | Very fat. |
Emma W..... | 1.6451 | 1.6128 | - 2.0 | + 11.6 | 26 | 57.6 | 164.8 | 33.3 | Normal. |
Child: | |||||||||
Anna M...... | 0.3699 | 0.3592 | -2.9 | + 9.3 | 2 | 6.3 | 73.2 |
As the "Linear Formula" involved taking 19 measurements, a simpler procedure was sought. The formula A = W½ X H½ X 167.2, in which A = area in square meters, W = weight in kilograms, and H = height in centimeters, was found to give an average error of 2.2 per cent. The average error could be reduced to 1.7 per cent, by using the formula,
A = w 0.425 X H°.725 X 71.84.
Based on this formula a chart1 has been devised by which it is possible to estimate the surface area at a glance. It is reproduced in Fig. 9.

Fig. 9. - Chart for determining surface area of man in square meters from weight in kilograms (Wt.) and height in centimeters (Ht.) according to the formula: Area (Sq. Cm.) = Wt. 0.425 X Ht. 0.725 X 71.84.
The old formula of Meeh gives a close approximation to 34.7 calories per square meter of surface per hour as the measure of the basal metabolism. In people of normal shape this result is so constant that it justifies the conclusion that the basal heat production can be determined by Meeh's formula, whether Meeh's formula for determining surface area is correct or not.
1 Du Bois, D. and E. F.: "Archives of Internal Medicine," 1016, xvii, 863.
The new formula gives the following results, the subjects being men between the ages of twenty and fifty years:
Average Calories per Sq. Meter per Hour. | Maximum Variation from Average in Per Cent. | |
Average 9 normal controls (Du Bois1) | 39.7 | +4 and -6 |
Average 9 normal controls (Means2). | ... 39.6 | +7.6 and -7.1 |
Average 82 normal controls (Benedict3). | ... 38.9 | usually ±10 |
As the results of Du Bois were obtained with calorimeter experiments of two or three hours' duration, the figure 39.7 calories per square meter of body surface per hour may be accepted as closely approximating the normal basal heat production of adult men. The experiments of Means and of Benedict were accomplished with the Benedict unit apparatus and bring confirmatory evidence.
Boothby4 finds that the metabolisms of 23 patients who recovered their health after operations, and who had been confined in the hospital between twenty and fifty days, most of the time in bed, were within ± 10 per cent, of the Du Bois normal standard. This establishes the validity of the use of this measure of the basal metabolism as a criterion of an altered metabolism in hospital patients.
Du Bois5 presents the following standards of basal metabolism with regard to age and sex. Figure 10 gives a graphic presentation of the data as applied to men.
1 Gephart and Du Bois: "Archives of Internal Medicine," 1916, xvii, 902.
2 Means: "Journal of Medical Research," 1915, xxxii, 121; "Journal of Biological Chemistry," 1915, xxi, 263.
3 Benedict, Emmes, Roth, and Smith: "Journal of Biological Chemistry," 1914, xviii, 139.
4 Boothby: Oral communication, published by permission.
5 Du Bois: "Archives of Internal Medicine," 1916, xvii, 887, and Aub and Du Bois, unpublished.
Cal. Per Square Meter Per Hour
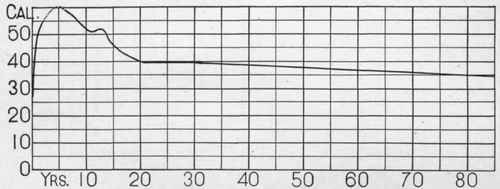
Fig. 10. - This chart, prepared by Du Bois, shows the basal metabolism as measured in calories produced per square meter of body surface per hour from birth until the age of eighty-five years in human males. Between maturity and the eighty-fifth year there is a gradual fall in the intensity of metabolism of 13 per cent. For consideration of the earlier part of the curve, see p. 406.
Subjects. | Age in Years. | Calories per Hour | per Square Meter. |
Meeh. | Du Bois (Height.Weight) . | ||
Boys .................. | 12.13 | 45.7 | 49.9 |
Men ............... | 20.50 | 34.7 | 39.7 |
Women .................. | 20.50 | 32.3 | 36.9 |
Men ................... | 50.60 | 30.8 | 35.2 32.7 |
Women .................. | 50.60 | 28.7 | |
Men ................... | 77.83 | .... | 35.1 |
The table shows that boys just before puberty have a high metabolism (see p. 559), that men have a higher metabolism than women, and that with advancing age there is no longer the same intensity of oxidation as in the prime of life.
The greater validity of the Du Bois formula over that of Meeh is shown in the following comparison by Du Bois of the metabolism of fat and thin subjects, computed in larger part from the work of Benedict, Emmes, Roth, and Smith:
' | Number of Subjects. | Calories per Sq. Meter Average Variation from Normal Standard in Per Cent. | Calories per Kilogram in Twenty.four Hours. | |
Meeh. | Du Bois. | |||
Fat men............. | 5 | -7.6 | - 4.0 | 21.9 |
Thin men........... | 4 | +6.4 | - 5.0 | 29.0 |
Fat women.......... | 7 | - 12.2 | O. | 19.4 |
Thin women......... | 6 | 4.2 | - 4.0 | 29.1 |
It is evident from this analysis that although thin women produce about 50 per cent, more heat per kilogram of body substance than their obese companions, yet per square meter of surface there is little difference.
The metabolism of a fat boy and his thin brother follow the same rule (see p. 257). Tangl1 obtained the following results with pigs:
Weight | Calories in Twenty-four Hours: | |
in Kg. | Per Kg. | Per Sq. Meter (Meeh). |
121 ......................... | 19.6 | 1060 |
49.............................. | 27.2 | 1100 |
1 Tangl: Biochemische Zeitschrift," 1912, xliv, 252.
For the study of metabolism processes it is certainly most fortunate that the unit of surface area eliminates the same amount of heat in the normal adult within 10 per cent, of a determined average. The reason is not clear. But the reasons why the body temperature is constant or why the menstrual period is exactly timed are also not clear, though as facts they are established.
Continue to:
My Books

