The Photographic Rendering Of Tone Values. II. The Translation Of The Tones Of The Subject Into The Opacities Of The Negative
Description
This section is from the "Studio Light Incorporating The Aristo Eagle - The Artura Bulletin 1917" book, by Aristo Motto. Also see Amazon: Studio Light Incorporating The Aristo Eagle - The Artura Bulletin 1917.
The Photographic Rendering Of Tone Values. II. The Translation Of The Tones Of The Subject Into The Opacities Of The Negative
The purpose of the photographic process is to reproduce the scale of tones which occur in the subject photographed as a corresponding scale of tones in the print, and the first step in this is the production of the negative. If this step does not involve any distortion of the scale of tones, we may say that we have a "technically perfect" negative, and we may define a "technically perfect" negative as one in which the opacities of its gradations are proportional to the light reflected by those portions of the original subject which they represent.
In order to understand this we must define "opacity" and we can do this by saying that the "opacity" is the optical property of a substance - in our case the silver of the negative image - to impede the passage of light through it.
"Transparency" is the inverse of this and is the fraction of the original light which is transmitted, so that a deposit of silver which transmits one-half of the light falling upon it has an opacity of 2. If we have a scale of tones in our subject reflecting light in the proportion of 1-2-5-10-20-50, then the technically perfect negative must let light through in the inverse proportion, that is, must have transparencies of l- ½-1/5-1/10-1/20-1/50. If this result is attained, the negative will be technically perfect and will have fulfilled the first step in the reproduction of the scale of tones which occur in the subject photographed. In the following table is given the relation existing between the scale of tones of the subject and the opacities of a "perfect" negative:
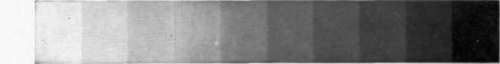
Fig. 1.
Brightness Of Different Tones Of Subject
1 2 5 10 20 50
Transparency Of Corresponding Deposits In The Negative
1 ½ 1/5 1/10 1/20 1/50
"Opacity" Of Deposits In The Negative
1 2 5 10 20 50
If we have a number of these different opacities in a negative and measure the amount of the deposit of silver which produces each, we find that each time the opacity is doubled an equal amount of silver is added to the deposit so that there is a relation between the amount of silver and the opacity, and knowing the amount of silver, we can find the opacity.
The optical quantity corresponding to the amount of silver is called the "density" and the "density" therefore increases by an equal amount each time the opacity is doubled.
Let us try to learn what happens when a plate is exposed to the action of light and is developed. Take a strip of plate and expose a portion of it to light just long enough to show a barely perceptible blackening after development; then another portion for twice the time, another four times, another eight times, another sixteen times, and so on, so that our strip will finally be made up of steps which have received amounts of light in the proportion of 1-2-4-8-16-32-64-128-256-512. We might do this by making an instrument so that we had different intensities of light in the form of steps and then expose the plate in this instrument, but in practice it is generally more convenient to give a series of different times of exposure. Fig. 1 represents the negative we shall get after development.
If the negative correctly represents these different times of exposure in the opacities obtained, the opacities should be in the same numerical ratio as the times of exposure, that is, they should be 1-2-4-8-16-32-64-128-256-512, and since each time the opacity is doubled the density increases an equal amount, the density (that is, the amount of silver) would be in the proportion 0-1-2-3-4-5-6-7-8-9, as shown in the following table:
Exposures
1 2 4 8 16 32 64 128 256 512
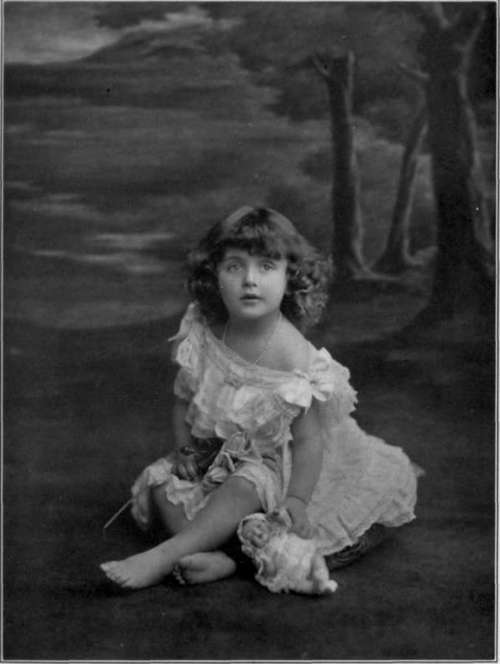
Portrait by Benjamin Paris, France.
Opacities
1 2 4 8 16 32 64 128 256 512
Densities
0123456789 that is, if we cut an imaginary section through the negative so as to show the height of the deposit of silver, it would look as shown in Fig. 2 or, since this kind of diagram is inconvenient to use, we might represent it by the height of the lines shown in the next diagram:
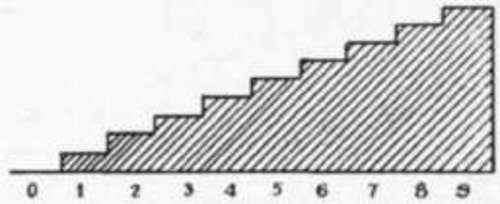
Fig. 2.
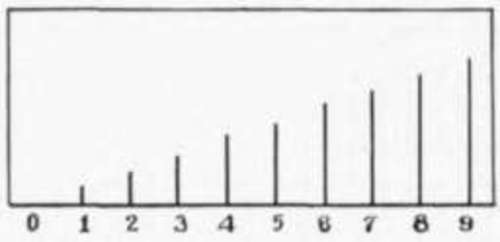
Fig. 3.
If we actually try this experiment upon a plate, however, we find that the densities do not show this equal rise with exposure throughout the entire scale. What we get instead is shown in Fig. 4, and this diagram requires careful study. Starting at A and proceeding to B we notice that at the beginning in the lower exposures the steps are marked by a gradually increasing rise, and therefore in this part of the exposure scale there will be too great a gain in opacity for each given increase of exposure. A negative the gradations of which fall in this period will yield prints in which an increasing contrast is shown between tones of uniform increase of brightness; that is to say, it will appear what we term "underexposed." From this period at B we pass imperceptibly into the period where the densities show an equal rise for each equal increase of exposure, and here we have our technically perfect negative, that is, one in which the opacities are exactly proportional to the light intensities of the subject. This is termed the "period of correct exposure," and only through this period of the curve where the opacities are directly proportional to the exposures and where the densities show an equal increase each time the exposure is doubled shall we get a perfect rendering of the original subject. From the point C onwards we have a gradually decreasing rise in the steps with increase of exposure until finally the increase of density with further exposure becomes imperceptible. This period is the period of over-exposure, in which the opacities of the negative fail to respond to increasing amounts of exposure and the correctness of rendering is again lost. It will be seen at once, then, from this curve that only through the period of correct exposure where equal increases of exposure are represented by equal rises in density can the tones of the original subject be correctly reproduced in the print.
Continue to:
My Books

