Chapter 4, Note 2. Blood Titrimetric Alkalinity And Urinary Ph
Description
This section is from the book "Research In Physiopathology As Basis Of Guided Chemotherapy With Special Application To Cancer", by Emanuel Revici. Also available from amazon: Research In Physiopathology
Chapter 4, Note 2. Blood Titrimetric Alkalinity And Urinary Ph
The important role of the kidney in regulating the acid base balance of the blood has been described (209) and a general relationship between daily acid excretion and plasma bicarbonate has been recognized. (210) However, a consistent relationship between blood acid base variations and urine changes has not been clearly established.
The determinations of blood pH and C02 combining power are the most commonly employed methods for following acid base changes. However, they indicate only certain distinctive factors intervening in acid base balance. The pH is a measurement of the dissociated elements in the blood and is maintained within narrow limits by the buffer mechanisms, while the C02 combining power is a measurement of only one of the multiple factors in the buffer system, the bicarbonate group. (211) The inconsistent relationship between variations in urinary pH and blood values indicate that changes in urinary pH depend upon factors other than the blood's dissociated substances and bicarbonate carbonic acid buffer mechanism. The phosphates, proteins and hemoglobin are among the members of other important buffer systems that have a role in the control of the acid base balance of the blood. (Figs. 203, 204)
The titrimetric alkalinity of the blood represents a measurement of the totality (reserve supply) of the substances, both dissociated and non dissociated, that are involved in the maintenance of the acid base balance of the blood. (212) We considered it interesting to examine the relationship between blood titrimetric alkalinity and urinary pH. Concomitant variations were compared.
Human subjects and dogs without apparent kidney dysfunction were used. Blood was obtained by venipuncture with an accurately calibrated dry syringe. After the needle was introduced into the vein and before withdrawing blood, the tourniquet was released for several minutes to avoid changes due to stasis.
Exactly 5 cc. of blood was introduced directly into a flask containing 30 cc. of a 0.001 N sodium hydroxide solution. The flask was immediately closed with a rubber stopper and the mixture agitated sufficiently to assure homogeneity. If determinations were not carried out at once, flasks were stored at 5°C and then brought to room temperature (20°C) before analysis. Fifty cc. of distilled water was used as a wash when flask contents were transferred to a beaker for titration. The total alkalinity was determined by electrometric titration to pH 7.0 against a .01N hydrochloric acid solution using a Beckman pH meter, Model G, and a mechanical stirrer. Blanks of 30 cc. of the sodium hydroxide solution were stored and treated in the same manner.
Urine specimens from the human subjects were obtained through complete emptying of bladder contents by voluntary micturition. An indwelling catheter was used for dogs and some humans. Specimens were placed in containers closed with rubber stoppers and stored at 5°C. They were brought to room temperature before tests. The pH values were determined electrometrically.

Fig. 203. The comparison between the concomitant changes seen in various blood and urine analyses concerning the acid base balance of the body. It shows that the variations of the titrimetric alkalinity of the total blood are the only values which constantly parallel those of the urinary pH. (Patient with breast cancer).
Blood specimens were collected each hour for at least five consecutive hours. Urine samples were obtained every thirty minutes, as specimens accumulated in the bladder during the half hour preceding bleeding and again during the half hour following bleeding. The pH values of the urine specimens were plotted separately on graphs as A and B curves. Comparison was then made between the two urine curves and the curve representing the values of the blood titrimetric alkalinity, using time as abscissa. In another group of experiments using dogs, the bladder contents were drained at intervals of from five to ten minutes and blood specimens were obtained every thirty minutes.

Fig. 204. In some cases the changes in several blood analyses parallel the changes of urinary pH. (Subject with metastatic melanoma).
Several preliminary tests were carried out to determine the degree of accuracy of the methods used. By employing a 0.001 N NaOH solution, a probable error of no more than 0.1 cc. was found.
Comparisons between titrimetric alkalinity of hourly blood specimens and half hourly urine specimens were made in thirty human and seven canine subjects. In all cases, the curves of blood titrimetric alkalinity values showed a consistent parallelism to the pH curves of urine specimens that accumulated in the bladder during the thirty minutes preceding the bleeding and were collected at the time of venipuncture. (Fig. 206) The curves representing the pH values of urine specimens accumulated in the bladder during the thirty minutes after each bleeding (B curves) did not show the same consistent correlation to the blood titrimetric alkalinity. (Fig. 207) In several tests, collections of half hourly urine specimens were made fifteen minutes before and fifteen minutes after each bleeding. The same parallelism was found between the pH of urine accumulated in the bladder during the period from fifteen minutes before to fifteen minutes after bleeding, and the titrimetric alkalinity of blood specimens drawn in the middle of the urine collection period. The pH curves of urine specimens accumulated during the period from fifteen to forty five minutes after each bleeding showed no consistent correlation.
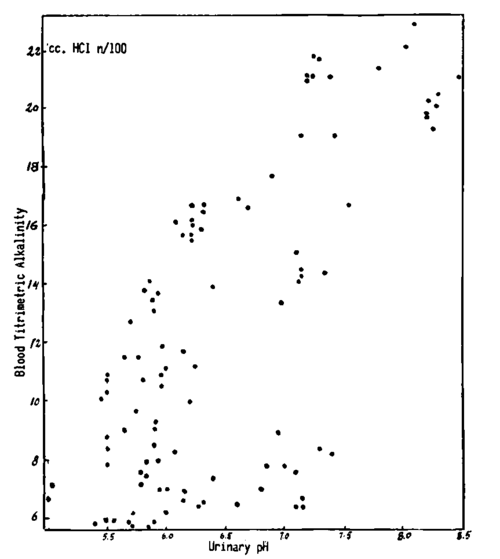
Fig. 205. The comparison between the concomitant values of urinary pH and of the titrimetric alkalinity of the blood shows that this relationship concerns more the occurring changes and less the absolute values of the findings. Urine samples with the same pH, in different subjects, are seen to correspond to blood samples with different titrimetric alkalinity.
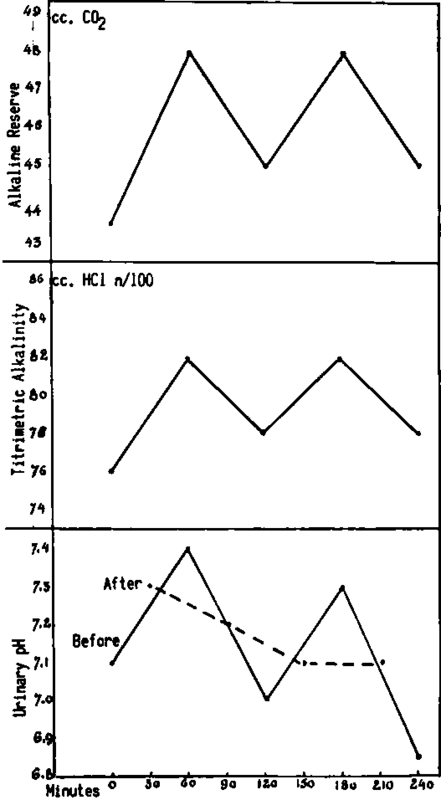
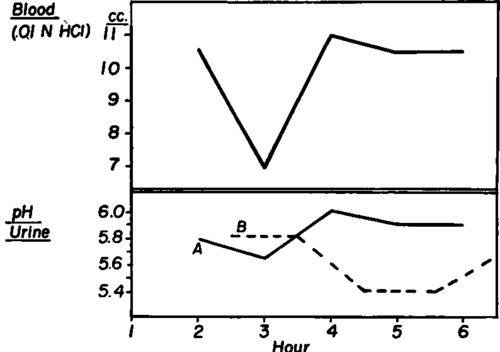
Fig. 206. Comparison of the hourly blood titratable alkalinity (in terms of cc. of .OIN HCl) and half hourly pH curves in a human subject. Urine curves A and B represent the before and after bleeding specimens. The parallelism between the titratable alkalinity of blood and the urine curve A is clearly shown. Curve B shows no correlation.
Fig. 207. Comparison of the curves representing hourly blood titratable alkalinity (in terms of cc. of .OIN HC1) and urine pH in a human subject. Urine pH curve "Before" shows values of specimens accumulated in bladder during the half hour immediately preceding and collected at the time of bleeding, while urine pH curve "After" is for specimens collected one half hour after bleeding. There is a definite parallelism only between the curves of the titratable alkalinity of blood and the urine pH curve A.
When urine and blood specimens were obtained at shorter intervals, the same tendency of urine pH changes to precede the changes in blood titrimetric alkalinity was observed. In Figure 208 a rapid rise in urine pH is seen to begin within twenty minutes of the time of administration of sodium bicarbonate. The blood titrimetric alkalinity does not show an elevation for at least forty five minutes.
These studies have shown that urinary pH variations correspond closely to changes in the values of an important factor reflecting acid base balance changes of the blood, the titrimetric alkalinity. As a result, it has been possible to employ variations in urinary pH as indications of qualitative changes in acid base balance of the blood for other studies.
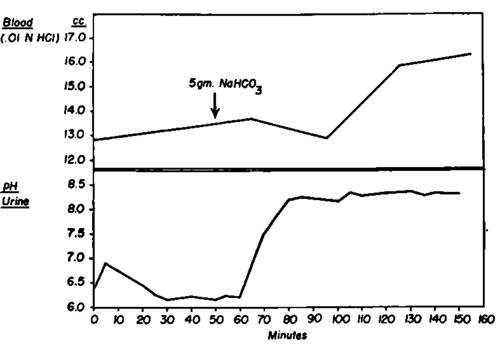
Fig. 208. The effect of the administration of 5 grams of sodium bicarbonate upon the blood titratable alkalinity and urine pH curves in dog. The elevation in urine pH is seen to precede by twenty five minutes that of the titratable alkalinity of the blood.
Continue to:
My Books

