


The Individual Psychological Measurements. (6) Strength Of Grip. Part 2
Description
This section is from the book "Human Vitality And Efficiency Under Prolonged Restricted Diet", by Francis G.BENEDICT, Walter R. Miles, Paul Roth, And H. Monmouth Smith. Also available from Amazon: Human Vitality and Efficiency Under Prolonged Restricted Diet.
The Individual Psychological Measurements. (6) Strength Of Grip. Part 2
The data for the two squads may be most conveniently compared if plotted as curves. Figures 107 and 108 give the averages for the evening and morning tests, respectively. In figure 107 both curves for Squad A are definitely below those for B.1 The right-hand curve is, in both cases, distinctly above that for the left hand. Squad A does slightly better in the second experiment than in the first, and from this point there is a gradual decline most prominent with the left hand. There is a rise with the left hand on January 12, the right remaining at the lower level but the left hand curve drops down again on January 26 and February 2. With B the right-hand curve shows a general but slight and intermittent improvement. The left hand curve has a reverse course, but the decline is also small, and not so conspicuous as in the case of Squad A. In the last three experiments (the low-diet period) there is no marked change.
1 Williams (Arch. Intern. Med., 1917, 20, p. 399), in his study of the Allen fasting treatment on the physical vigor of diabetics, measured the strength of grip with a Collins dynamometer. He found diabetics to be distinctly weaker than normal people. Muscular vigor in any subject was proportional to food tolerance rather than to the quantity ingested.
Table 163. - Squad A - Strength Of Grip At Morning Sessions
[Values given in kilograms].
Date. | Hand.1 | Bro. | Can. | Kon. | Gar. | Gul. | Mon. | Moy. | Pea. | Pec. | Spe. | Tom. | Vea. | Av. | |
1917. | |||||||||||||||
Oct. 28... | R. | M. | 48.7 | 53.5 | 60.6 | 48.9 | 59.8 | 33.5 | 47.6 | 46.1 | 46.2 | 47.5 | 47.1 | 46.8 | 47.6 |
S.D. | 2.44 | 1.51 | 1.32 | 2.15 | .68 | 3.77 | 2.54 | 3.47 | .97 | 2.97 | 3.50 | 1.86 | 2.29 | ||
C. | 5.2 | 2.8 | 2.2 | 4.4 | 1.1 | 11.2 | 5.3 | 7.5 | 2.1 | 6.3 | 7.4 | 4.0 | 5.1 | ||
L. | M. | 39.6 | 46.2 | 55.8 | 42.3 | 49.2 | 35.0 | 45.8 | 49.3 | 47.8 | 48.8 | 44.3 | 45.7 | 44.5 | |
S.D. | 1.02 | 1.17 | 3.93 | 1.17 | 2.79 | 3.35 | 2.30 | 2.75 | 1.23 | 1.45 | 2.51 | 1.09 | 1.94 | ||
C. | 2.6 | 2.5 | 7.0 | 2.8 | 5.7 | 9.6 | 5.0 | 5.6 | 2.6 | 3.0 | 5.7 | 2.4 | 4.5 | ||
Nov. 11. .. | R. | M. | 48.8 | 56.9 | 60.5 | 49.1 | 57.7 | 43.8 | 42.9 | 50.0 | 44.5 | 43.0 | 50.1 | 44.6 | 48.8 |
S.D. | 1.12 | .80 | .63 | 2.24 | 2.96 | 1.17 | 1.66 | 1.41 | .63 | 1.92 | 1.20 | 3.17 | 1.64 | ||
C. | 2.3 | 1.4 | 1.0 | 4.6 | 5.1 | 2.7 | 3.9 | 2.8 | 1.4 | 4.5 | 2.4 | 7.1 | 3.4 | ||
L. | M. | 42.5 | 51.2 | 56.0 | 41.7 | 51.3 | 36.8 | 39.6 | 52.0 | 43.6 | 45.9 | 46.8 | 42.0 | 44.8 | |
S.D. | 1.00 | 2.29 | 1.92 | .75 | 2.69 | 1.03 | 1.50 | 1.27 | .49 | 2.90 | 1.51 | 1.14 | 1.37 | ||
C. | 2.4 | 4.5 | 3.4 | 1.8 | 5.2 | 2.8 | 3.8 | 2.4 | 1.1 | 6.3 | 3.2 | 2.7 | 3.0 | ||
Nov. 25... | R. | M. | 49.2 | 52.5 | 52.2 | 49.4 | 54.9 | 44.5 | 41.7 | 43.7 | 41.9 | 46.0 | 49.3 | 45.8 | 47.3 |
S.D. | 1.12 | 1.95 | 1.75 | 1.99 | 1.66 | 1.18 | 3.34 | 2.31 | .80 | 1.70 | 1.21 | 2.80 | 1.84 | ||
C. | 2.3 | 3.7 | 3.4 | 4.0 | 3.0 | 2.7 | 8.0 | 5.3 | 1.9 | 3.7 | 2.5 | 6.1 | 4.0 | ||
L. | M. | 42.2 | 47.7 | 51.6 | 42.9 | 56.5 | 33.1 | 42.0 | 48.6 | 43.0 | 46.6 | 46.7 | 40.7 | 44.3 | |
S.D. | 1.21 | 2.31 | 1.07 | 1.56 | 2.76 | 2.35 | 1.18 | 1.50 | .32 | 2.22 | 1.08 | 2.01 | 1.63 | ||
C. | 2.9 | 4.8 | 2.1 | 3.6 | 4.9 | 7.1 | 2.8 | 3.1 | 0.7 | 4.8 | 2.3 | 4.9 | 3.7 | ||
Dec. 9... | R. | M. | 49.9 | 51.6 | 49.3 | 47.3 | 50.6 | 44.1 | 39.6 | 38.9 | 40.9 | 44.8 | 44.8 | 45.1 | 45.3 |
S.D. | 1.07 | 1.88 | 1.83 | 1.54 | 2.65 | 1.11 | 2.18 | 4.70 | .58 | 3.35 | 1.83 | 1.28 | 1.88 | ||
C. | 2.4 | 3.6 | 3.7 | 3.3 | 5.2 | 2.5 | 5.5 | 12.1 | 1.4 | 7.5 | 4.1 | 2.8 | 4.3 | ||
L. | M. | 41.8 | 45.2 | 50.8 | 40.9 | 45.5 | 33.8 | 39.0 | 46.9 | 41.2 | 46.5 | 42.1 | 38.1 | 41.5 | |
S.D. | .98 | 1.50 | 1.12 | 1.20 | 1.23 | 2.40 | 2.30 | 1.07 | .68 | 1.38 | .66 | 1.11 | 1.31 | ||
C. | 2.3 | 3.3 | 2.2 | 2.9 | 2.7 | 7.1 | 5.9 | 2.3 | 1.6 | 3.0 | 1.6 | 2.9 | 3.3 | ||
1918. | |||||||||||||||
Jan. 13... | R. | M. | 50.9 | 52.0 | 54.3 | 49.0 | 54.4 | 44.7 | 43.3 | 38.9 | 43.5 | .. | 45.4 | 43.3 | 46.5 |
S.D. | .80 | 1.23 | .93 | 1.38 | 1.86 | 2.42 | 1.50 | 4.77 | .95 | .. | 1.24 | 1.15 | 1.73 | ||
C. | 1.6 | 2.4 | 1.7 | 2.8 | 3.4 | 5.4 | 3.5 | 12.3 | 2.2 | .. | 2.7 | 2.7 | 4.1 | ||
L. | M. | 42.1 | 47.8 | 54.2 | 39.9 | 45.3 | 37.6 | 37.2 | 48.5 | 43.1 | .. | 41.0 | 40.3 | 42.3 | |
S.D. | 1.24 | 1.63 | .75 | 1.66 | 1.68 | 2.31 | 1.44 | 1.79 | .66 | .. | 1.52 | 1.15 | 1.51 | ||
C. | 2.9 | 3.4 | 1.4 | 4.2 | 3.7 | 6.1 | 3.9 | 3.7 | 1.5 | .. | 3.7 | 2.9 | 3.6 | ||
Jan. 27... | R. | M. | 49.2 | 50.2 | 55.6 | 45.9 | 52.9 | 45.2 | 41.3 | 41.6 | 40.2 | .. | 45.0 | 43.9 | 45.5 |
S.D. | .75 | 3.08 | 1.90 | 1.02 | 2.08 | 1.36 | 2.04 | 2.98 | 1.03 | .. | .89 | .92 | 1.62 | ||
C. | 1.5 | 6.1 | 3.4 | 2.2 | 3.9 | 3.0 | 4.9 | 7.2 | 2.6 | .. | 2.0 | 2.1 | 3.6 | ||
L. | M. | 42.4 | 48.5 | 51.5 | 38.5 | 45.9 | 35.0 | 39.6 | 48.7 | 40.4 | .. | 41.1 | 39.9 | 42.0 | |
S.D. | 1.20 | 1.60 | 1.95 | 1.24 | 3.01 | 1.52 | 1.20 | 2.09 | 1.88 | .. | .80 | 1.56 | 1.61 | ||
C. | 2.8 | 3.3 | 3.8 | 3.2 | 6.6 | 4.3 | 3.0 | 4.3 | 4.7 | .. | 1.9 | 3.9 | 3.8 | ||
Feb, 3... | R. | M. | 50.7 | 56.4 | 57.2 | 46.1 | 52.5 | 47.2 | 44.9 | 39.2 | 39.9 | .. | 50.1 | 42.8 | 47.0 |
S.D. | .75 | .86 | .75 | .92 | 1.14 | 1.47 | .49 | 4.27 | .58 | . | 1.36 | .25 | 1.21 | ||
C. | 1.5 | 1.5 | 1.3 | 2.0 | 2.2 | 3.1 | 1.1 | 10.9 | 1.5 | .. | 2.7 | 0.6 | 2.7 | ||
L. | M. | 43.6 | 52.5 | 54.3 | 38.5 | 46.0 | 39.3 | 45.0 | 46.2 | 40.9 | .. | 45.1 | 38.2 | 43.5 | |
S.D. | .58 | .32 | .93 | 2.44 | 1.14 | 1.60 | 1.55 | .68 | .86 | .. | 3.14 | .40 | 1.27 | ||
C. | 1.3 | 6.1 | 1.7 | 6.3 | 2.5 | 4.1 | 3.4 | 1.5 | 2.1 | .... | 7.0 | 1.0 | 3.5 | ||
Low-diet av. | R. | M. | 49.3 | 53.3 | 55.7 | 45.0 | 54.7 | 43.3 | 43.0 | 42.6 | 42.4 | 45.3 | 47.4 | 44.6 | 46.9 |
S.D. | 1.15 | 1.62 | 1.30 | 1.61 | 1.86 | 1.78 | 1.96 | 3.42 | .79 | 2.49 | 1.60 | 1.66 | 1.74 | ||
C. | 2.4 | 3.1 | 2.4 | 3.3 | 4.2 | 4.4 | 4.6 | 8.3 | 1.9 | 5.5 | 3.4 | 3.6 | 3.9 | ||
L. | M. | 42.0 | 48.4 | 53.5 | 40.7 | 48.5 | 35.9 | 41.2 | 48.6 | 42.9 | 47.0 | 43.9 | 40.7 | 43.3 | |
S.D. | 1.03 | 1.55 | 1.67 | 1.43 | 2.19 | 2.08 | 1.64 | 1.59 | .87 | 1.99 | 1.60 | 1.21 | 1.52 | ||
C. | 2.5 | 3.6 | 3.1 | 3.5 | 4.5 | 5.9 | 3.9 | 3.3 | 2.0 | 4.3 | 3.6 | 2.4 | 3.6 | ||
1R. and L designate right and left hands; M., mean or average; S. D., standard deviation; and C, coefficient of variability.
Table 164. - Squad B - Strength Of Grip At Morning Sessions
[Values in kilograms].
Date. | Hand.1 | Fis. | Har. | How. | Ham. | McM. | Kim. | Lon. | Mac. | Sch. | Liv. | Sne. | Tho. | Van. | Wil. | Av. | |
1917 | |||||||||||||||||
Nov. 4 | R. | M. | 56.3 | 51.5 | 61.1 | 50.6 | 44.4 | .. | 55.7 | 56.6 | .. | 46.5 | 59.4 | 51.9 | 58.0 | 52.5 | 54.4 |
S.D. | 1.78 | 2.23 | 1.32 | 1.39 | 3.15 | .. | 3.97 | 1.39 | .. | 1.14 | 2.54 | 2.15 | 1.82 | 1.41 | 1.98 | ||
C. | 3.2 | 4.3 | 2.2 | 2.7 | 7.1 | .. | 7.1 | 2.5 | .. | 2.5 | 4.3 | 4.1 | 3.1 | 2.7 | 3.6 | ||
L. | M. | 52.9 | 51.7 | 53.6 | 48.0 | 37.8 | .. | 47.8 | 49.2 | .. | 44.5 | 60.4 | 48.0 | 55.5 | 48.7 | 51.1 | |
S.D. | 1.88 | 2.48 | 1.20 | 1.58 | 2.11 | ... | 3.72 | 1.21 | .. | .95 | 1.39 | 1.64 | 1.00 | 1.47 | 1.73 | ||
C. | 3.6 | 4.8 | 2.2 | 3.3 | 5.6 | ... | 7.8 | 2.5 | .. | 2.1 | 2.3 | 3.4 | 1.8 | 3.0 | 3.4 | ||
Nov. 18 | R. | M. | 56.6 | 48.2 | 62.2 | 43.6 | 47.3 | .. | 55.6 | 54.8 | .. | 45.1 | 57.8 | 53.3 | 57.5 | 52.7 | 53.3 |
S.D. | 1.28 | 1.29 | 4.01 | 1.83 | 3.03 | ... | 2.01 | 1.57 | .. | 1.20 | 1.63 | 3.26 | 1.70 | .93 | 1.91 | ||
C. | 2.3 | 2.7 | 6.4 | 4.2 | 6.4 | .. | 3.6 | 2.9 | .. | 2.7 | 2.8 | 6.1 | 3.0 | 1.8 | 3.6 | ||
L. | M. | 53.4 | 50.2 | 53.2 | 43.2 | 40.3 | .. | 47.7 | 50.2 | .. | 44.8 | 56.8 | 46.6 | 55.2 | 51.1 | 50.2 | |
S.D. | 2.74 | 2.04 | 1.86 | 1.75 | .40 | ... | 1.78 | 1.58 | .. | .93 | 2.46 | 1.83 | 1.12 | 3.60 | 2.01 | ||
C. | 5.1 | 4.1 | 3.5 | 4.1 | 1.0 | .. | 3.7 | 3.1 | .. | 2.1 | 4.3 | 3.9 | 2.0 | 7.0 | 4.0 | ||
Dec. 16 | R. | M. | .. | 46.9 | 60.1 | 42.9 | 47.2 | .. | 55.6 | 55.0 | .. | 44.4 | 59.5 | 49.5 | 55.1 | 49.5 | 51.9 |
S.D. | • • • • | 1.39 | 3.38 | 3.38 | 2.45 | .. | 1.77 | 2.47 | .. | 1.77 | 1.10 | 1.34 | .66 | 2.41 | 1.91 | ||
C. | .. | 3.0 | 5.6 | 7.9 | 5.2 | .. | 3.2 | 4.5 | ... | 4.0 | 1.8 | 2.7 | 1.2 | 4.9 | 3.7 | ||
L | M. | .. | 47.3 | 50.1 | 44.6 | 36.3 | .. | 50.7 | 51.2 | ... | 44.8 | 58.7 | 45.1 | 52.2 | 45.9 | 48.8 | |
S.D. | .. | 1.26 | 1.32 | 3.38 | 2.23 | .. | 5.08 | 2.77 | .. | .98 | 1.36 | 1.27 | 1.03 | 1.96 | 1.96 | ||
C. | ...... | 2.7 | 2.6 | 7.6 | 6.1 | .. | 10.0 | 5.4 | .. | 2.2 | 2.3 | 2.8 | 2.0 | 4.3 | 4.0 | ||
1918 | |||||||||||||||||
Jan. 6 | R | M | 56.9 | 49.3 | 59.0 | 48.0 | 49.7 | 44.5 | .. | .. | 57.5 | 45.3 | 54.2 | 49.1 | 57.4 | 46.9 | 51.8 |
S.D. | .99 | 1.33 | 5.24 | 1.82 | .87 | 1.90 | .. | .. | 1.18 | .93 | 1.91 | 2.58 | 1.36 | 1.83 | 2.00 | ||
0. | 1.7 | 2.7 | 8.9 | 3.8 | 1.8 | 4.3 | .. | .. | 2.1 | 2.0 | 3.5 | 5.3 | 2.4 | 3.9 | 3.9 | ||
L. | M. | 54.6 | 51.4 | 50.0 | 45.1 | 38.3 | 44.5 | .. | .. | 54.0 | 44.5 | 53.7 | 45.0 | 54.5 | 45.8 | 49.4 | |
S.D. | 1.39 | 1.98 | 2.51 | 1.20 | 1.60 | 3.74 | .. | .. | 2.12 | .63 | 2.25 | 1.05 | .89 | 2.42 | 1.59 | ||
C. | 2.5 | 3.9 | 5.0 | 2.7 | 4.2 | 8.4 | .. | .. | 3.9 | 1.4 | 4.2 | 2.3 | 1.6 | 5.3 | 3.2 | ||
Normal av... | R. | M. | 56.6 | 49.0 | 60.6 | 46.3 | 47.2 | 44.5 | 55.6 | 55.5 | 57.5 | 45.3 | 57.7 | 51.0 | 57.0 | 50.4 | 52.9 |
M. | 53.6 | 50.2 | 51.8 | 45.2 | 38.2 | 44.5 | 48.7 | 50.2 | 54.0 | 44.7 | 57.4 | 46.2 | 54.4 | 47.9 | 49.9 | ||
Jan. 14 | R. | M. | 60.0 | 51.0 | 54.0 | 45.7 | .. | 41.0 | 55.0 | .. | 54.1 | 46.6 | 57.7 | 52.1 | 54.7 | 4S.8 | 52.6 |
S.D. | 2.10 | .95 | .57 | 1.66 | .. | 2.26 | 1.52 | .. | .66 | 1.07 | 1.25 | 2.15 | 1.69 | 1.03 | 1.40 | ||
C. | 3.5 | 1.9 | 1.1 | 3.6 | .. | 5.5 | 2.8 | .. | 1.2 | 2.3 | 2.2 | 4.1 | 3.1 | 2.1 | 2.7 | ||
L. | M. | 54.0 | 54.1 | 34.3 | 40.8 | .. | 44.0 | 47.4 | .. | 52.7 | 42.6 | 52.6 | 46.0 | 51.8 | 46.2 | 47.0 | |
S.D. | 1.52 | 1.77 | 1.89 | 3.11 | .. | 2.90 | 2.71 | .. | .97 | 1.70 | 1.39 | .84 | 1.63 | 2.80 | 1.94 | ||
C. | 2.8 | 3.3 | 5.5 | 7.6 | .. | 6.6 | 5.7 | .. | 1.8 | 4.0 | 2.6 | 1.8 | 3.1 | 6.1 | 4.1 | ||
Jan. 20 | R. | M. | 60.3 | 50.7 | 55.8 | 50.8 | .. | 45.1 | 50.4 | .. | 51.5 | 46.4 | 56.5 | 51.9 | 55.5 | 47.7 | 52.6 |
S.D. | .40 | 2.66 | 1.44 | 2.29 | .. | 1.74 | 2.27 | .. | 1.10 | 1.02 | 1.89 | 2.11 | 1.18 | 2.54 | 1.78 | ||
C. | 6.6 | 5.2 | 2.6 | 4.5 | .. | 3.9 | 4.5 | . | 2.1 | 2.2 | 3.3 | 4.1 | 2.1 | 5.3 | 3.4 | ||
L. | M. | 56.4 | 52.3 | 36.1 | 46.2 | .. | 46.1 | 43.3 | .. | 47.8 | 42.0 | 50.6 | 47.4 | 51.0 | 47.0 | 47.2 | |
S.D. | 2.03 | 3.09 | 1.50 | 1.17 | .. | 3.18 | 2.48 | .. | .51 | 1.10 | 2.42 | .58 | 1.27 | 4.00 | 1.96 | ||
C. | 3.6 | 5.9 | 4.2 | 2.5 | ... | 6.9 | 5.7 | .. | 1.1 | 2.6 | 4.8 | 1.2 | 2.5 | 8.5 | 4.2 | ||
Jan. 2s | R. | M. | 59.0 | 52.1 | 59.2 | 50.8 | .. | 49.2 | 53.5 | .. | 53.4 | 46.6 | 55.7 | 50.7 | 55.2 | 47.3 | 53.0 |
S.D. | .89 | 3.20 | .93 | 2.62 | .. | 2.42 | 2.10 | .. | 1.50 | .86 | 1.69 | 1.17 | .93 | .81 | 1.52 | ||
C. | 1.5 | 6.1 | 1.6 | 5.2 | .. | 4.9 | 3.9 | .. | 2.8 | 1.8 | 3.0 | 2.3 | 1.7 | 1.7 | 2.9 | ||
L. | M. | 56.5 | 50.8 | 42.5 | 45.3 | .. | 49.8 | 48.4 | .. | 51.2 | 42.1 | 53.7 | 44.1 | 52.4 | 48.2 | 48.4 | |
S.D. | 2.59 | 1.12 | 1.97 | 2.48 | .. | 2.36 | 1.02 | .. | .68 | .73 | 1.50 | 1.39 | .86 | 1.63 | 1.53 | ||
C. | 4.6 | 2.2 | 4.6 | 5.5 | .. | 4.7 | 2.1 | .. | 1.3 | 1.7 | 2.8 | 3.2 | 1.6 | 3.4 | 3.2 | ||
Low-diet av... | R. | M. | 59.8 | 51.3 | 56.3 | 49.1 | .. | 45.1 | 53.0 | .. | 53.0 | 46.5 | 56.6 | 51.6 | 55.1 | 47.9 | 52.7 |
L. | M. | 55.6 | 52.4 | 37.6 | 44.1 | ... | 46.6 | 46.4 | .. | 50.6 | 42.2 | 52.3 | 45.8 | 51.7 | 47.1 | 47.5 | |
1R. and L. designate right and left hands; M., mean or average; S. D., standard deviation; and C, coefficient of variability.
The difference in level between the curves of the two squads is significant but of unknown value, as records were not obtainable for the normal condition of Squad A before they began the reduced diet. As it was considered that the members of Squad A would have returned to somewhat near their normal condition by May 21, it was arranged that the 6 members of Squad A who still remained in college should take a strength of grip test with the same instrument and under the usual instructions and supervision. The data which were gathered are included in table 161 for the evening record. The data for each subject may be conveniently compared with the low-diet average immediately above. For May 21 Bro shows a right-hand average of 51.0 kg. as compared to a low-diet average of 51.6 kg., and a left-hand average of 45.8 compared to a low-diet average of 45.3 kg.; that is, with this subject there is practically no change. With the other 5 subjects, however, the condition is very different: Can shows for the right hand a rise from 54.0 to 57.5 and for the left hand from 47.6 to 53.9; Moy's record for the right hand changes from 44.5 to 52.6 and for the left hand from 42.1 to 52.4. Pea said his wrist was still weak and inefficient; his records show, however, an increase from 41.6 to 50.8 for the right hand and from 50.3 to 55.7 for the left hand. Spe gave a right-hand score which changed from 46.6 to 47.5, and for the left hand 46.5 to 48.1, and lastly, Vea shows right hand 45.4 to 51.9 and left hand a record of 41.1 as compared with his later average of 46.1. The averages for these 6 subjects of Squad evident that with the uncontrolled eating there was a change, at least with 5 out of 6 men, and the strength of grip had increased roughly 4.5 kg. with each hand. This is nearly enough to account for the difference in level of the two squads shown in figure 107. If a comparison is made between the low-diet averages for the 6 subjects under special consideration and the low-diet average for the whole group, as shown in table 161 (48.1 and 44.7 for the right and left hands, respectively), it will be noted that these 6 men average very nearly the same as the whole group. It is therefore permissible to plot points on figure 107, showing the level of the performance of May 21. This has been done at the right side of the figure. These two points are seen to be definitely above any other performance of Squad A and to be in the range of Squad B, although in the case of the right hand not so high.1 The curves for the morning records (fig. 108) show the interesting result that both squads are a little nearer the same level, although Squad B is still at a higher level than Squad A. The gradual decline shown by the records of Squad B from the first performance of November 4 is striking. Squad B made their best morning record on the first morning experiment, November 4. It is difficult to assign a reason for this gradual decline in succeeding sessions. The conditions in the morning were somewhat different from those in the evening, since each subject was tested by himself in room B; consequently, when the subject was making his record he did not have the stimulating presence of someone sitting at the side watching. It is possible that this factor may be of considerable importance here, as it is frequently noted in the literature on strength of grip and ergographic experiments. Squad B with the left hand shows a marked drop on the three dates, January 14, 20, and 28, which were during the low diet. There was, during the same period, a very slight rise in the record with the right hand. Squad A made their be t record at the second morning session, November 11. Following this, the irregularity is not marked, and all of the averages are definitely lower. There was somewhat of a rise on the morning of February 3, probably assignable to the more or less stimulating conditions at the close of the experiment, as the strength of grip followed the walking and was the last test before the subject broke training.
A during the low-diet period were right hand, 47.3, left hand, 45.5, as compared with the scores for May 21 with right hand 51.9 and left hand 50.3. The variability figures for these records of May 21 are, on the average, the smallest found at any time for Squad A, thus indicating great consistency in the records of that date. It seems very:
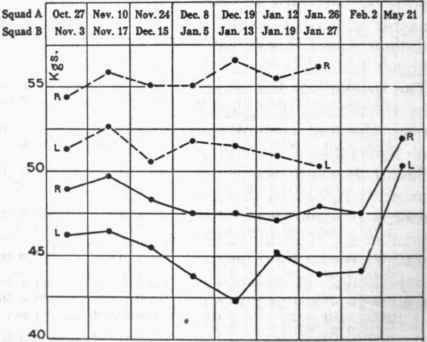
Fig. 107. - Averages for strength of grip at evening sessions and with six members of Squad A on one date following the low-diet experiment.
R and L designate right and left hands. Solid line curves represent Squad A, and broken lines Squad B.

Fig. 108. - Averages for strength of grip at morning sessions.
R and L designate values for right and left hands. Solid line curves represent Squad A, and broken lines, Squad B.
1 Of this group of 6 men tested on May 21, Pea and Spe were left-handed.
Continue to:


My Books

