The Individual Psychological Measurements. (6) Strength Of Grip. Part 3
Description
This section is from the book "Human Vitality And Efficiency Under Prolonged Restricted Diet", by Francis G.BENEDICT, Walter R. Miles, Paul Roth, And H. Monmouth Smith. Also available from Amazon: Human Vitality and Efficiency Under Prolonged Restricted Diet.
The Individual Psychological Measurements. (6) Strength Of Grip. Part 3
The variability in the strength of grip is shown in figures 109 and 110 for the evening and morning performance, respectively. Separate curves are given for the right and left hands. There appear no conspicuous differences between the two squads in relation to this factor. The variability value is always small, never larger than 6 per cent, even though there is considerable relative fluctuation in its size. The curves cross and recross, but in general maintain the same level. In the case of the evening records (fig. 109), Squad A has relatively a large variability with the left hand on October 27 (6 per cent). Following this, the variability usually ranges between 3 and 4 per cent. As the experiment continues, it tends to decrease. This irregular decrease in the variability is found with both squads and in both the evening and morning records, but is more prominent in the former. The small variability found on May 21 (see fig. 109) is remarkable and in striking contrast to that for October 27, the firs evening session, and for October 28, the first morning session (see fig. 110), even though 2 1/2 months intervened between February 2 and May 21.
In a strength test there are at least two conditions which favor increased variability: (1) any changing interest or fluctuating attention in connection with the test; (2) the extremeness of the muscular efforts with the result of quick development of fatigue or conditions which produce pain. Squad A made better averages in their first two sessions than in any of the subsequent periods, and the variability tends to be largest; there would seem to be some connection between these two factors. The changes in variability with Squad B are not so marked; they were about the same level all the time, with some decrease in the case of evening work particularly.
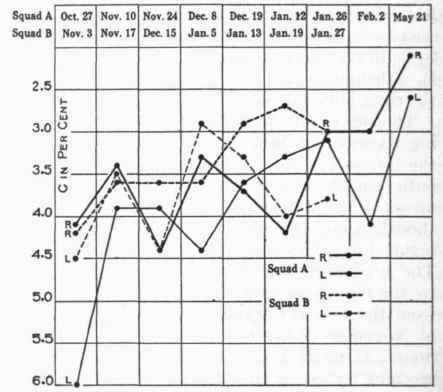
Fig. 109. - Variability in the average strength of grip at evening sessions.
R and L designate values for right and left hands.
In summarizing the effect of the reduced diet on the strength of grip, we have to consider these facts: (1) There are two squads of 10 men each with no apparent reason for believing that the average grip strength of one squad should be much greater than the other under normal conditions. With Squad A on reduced rations, we find a definite difference between the two groups of men. (2) Records taken with 6 of the members of Squad A after the reduced-diet period and at a time when it might be considered that the men had returned to approximately normal conditions, show, on the average, a strength of grip about 4.5 kg. greater than that demonstrated during the low-diet period. (3) There was a gradual reduction in the strength of grip with Squad A from the beginning until the last of the experiment. (4) In the 3 weeks' diet period with Squad B there was some reduction below the previous performance. (5) In all the records, the coefficient of variability for individual series of five trials remains quite constant at about 4 per cent, thus indicating uniformity of effort in the test. It would therefore seem that the strength of grip was definitely lowered by the reduced diet regime. In the absence of normal measurements for Squad A previous to the period of diet and for half of the men subsequent to the experiment, it is impossible to say how large the reduction may be. It is not unreasonable to believe that it averaged about 4 kg. in 50, which amounted to approximately an 8 per cent reduction in strength as exhibited in this test.
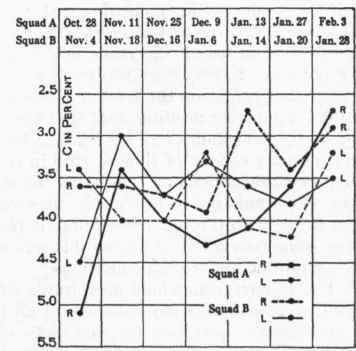
Fig. 110. - Variability in the average strength of grip at morning sessions.
R and L designate values for right and left hands.
Continue to:
My Books

