Transition Pulse. Part 4
Description
This section is from the book "Human Vitality And Efficiency Under Prolonged Restricted Diet", by Francis G.BENEDICT, Walter R. Miles, Paul Roth, And H. Monmouth Smith. Also available from Amazon: Human Vitality and Efficiency Under Prolonged Restricted Diet.
Transition Pulse. Part 4
The curve shown for Mon (figure 99) is an exception to the others in that no marked depressions appear, the pulse cycles tending to shorten continuously during the first whole minute of walking. A slight depression in the curve shows a lengthening of the cycle from 0.86 to 0.93 second between the fourth and eighth cycles, which probably corresponds to the more marked depressions at this point seen in other curves. The final transition pulse is also more uniform, but exhibits the usual change at the twentieth cycle from the lengthening duration which immediately appeared with standing.
The pulse of Pea (figure 100) was somewhat individual in that the quickened pulse immediately following the change from standing to walking held its level for 10 cycles and the main reaction did not set in until the eighteenth beat. The duration then suddenly changed from 0.87 to 1.19 seconds, which is slower than that of the preliminary standing cycles. The cycle remained at about this duration for the next 8 beats, when a fairly uniform shortening occurred. The curve for the standing transition is, in general, not unlike that shown for the majority of the other subjects. The final cycle measured has a duration of 1.19 seconds, which is slightly longer than the standing cycles preliminary to walking.
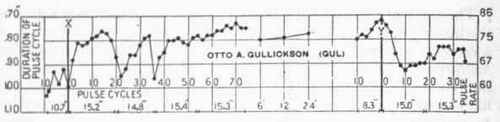
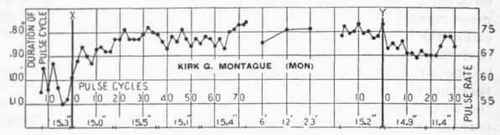
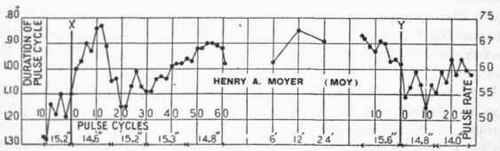
Fig. 99. - Transition pulse curves for Gullickson, Montague, and Mover, Squad A, February 3, 1918.
For detailed explanation, see figure 95.
In the walking transition curve for Vea (figure 100), the maximum shortening of the pulse cycle appears to have been reached at the eighth beat, with a duration of 1.00 second, which is maintained through the twelfth cycle. At the thirteenth cycle the photographic tracing shows that Vea's heart skipped a beat and in measuring the duration of the double cycle in which the missing thirteenth beat occurred, the average for two beats has been taken although only one beat (the fourteenth) showed on the record. This pulse cycle is marked by an asterisk (*) in the curve. It is seen that the heart tried to make up for this skip by a quickening of the rate in the succeeding two cycles, the duration showing a change from 1.02 to 0.96 second. This is the only instance of a skipped beat noted in all the records. With this exception, the curve of Vea is not unlike that of the others in this group.
The average durations of the pulse cycles for standing preliminary to the walking transition, estimated as for Squad B, page 431, are as follows: Bro, 0.86; Can, 0.82; Kon, 1.19; Gar, 1.38; Gul, 0.96; Mon, 1.02; Moy, 1.16; Pea, 1.05; Tom, 0.76; Vea, 1.16. The differences between these standing pulse-cycle durations and those for the minimum duration, which immediately follows the change to walking, range from 0.11 second for Bro to 0.55 second for Gar, with an average change for the squad of 0.24 second. Comparing these standing pulse-cycle durations with the durations which would correspond to the pulse-rates after the sixth and twenty-fourth minutes of walking, we find that the average change has been to shorten the duration 0.15 second for 6 minutes of walking and 0.20 second for 24 minutes of walking.
The average durations of the pulse cycles for Squad A just before walking ceased are found from the curves to be as follows: Bro, 0.81; Can, 0.81; Kon, 0.88; Gar, 0.96; Gul, 0.77; Mon, 0.81; Moy, 0.94; Pea, 0.92; Tom, 0.65; Vea, 0.94. Comparing these figures with the durations at the tenth, twentieth, and thirtieth cycles after walking ceased, as was done with Squad B, we find that the average pulse cycle for the squad has lengthened in its duration over that of walking 0.15, 0.10, and 0.09 second, respectively, while at these same points the pulse cycle is shorter than the average duration for the preliminary standing period by 0.05, 0.08, and 0.08 second, respectively.
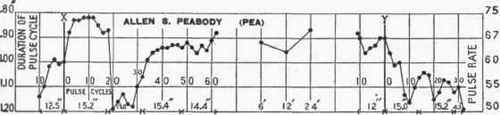
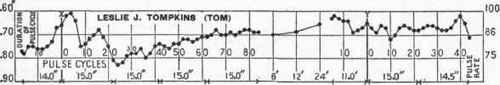
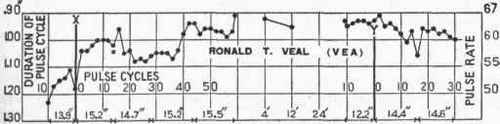
Fig. 100. - Transition pulse curves for Peabody, Tompkins, and Veal, Squad A, February 3, 1918.
For detailed explanation, see figure 95.
Continue to:
My Books

