Nuts As Food. Use In Diet
Description
This section is from the book "Food - What It Is And Does", by Edith Greer. Also available from Amazon: Food: What it is and Does.
Nuts As Food. Use In Diet
Nuts, like cereals, served as sustaining human food in earlier times. Later, nuts passed to use as diet-accessories, that is, food incidentals to substantial diet. When vigorous outdoor exercise was the common practice, food could be excessive, and health somewhat maintained. But with less physical activity, ill-health is the invariable outcome of an overburdened and overworked digestive tract.
As science has developed and engaged in a study of human nutrition, what all foods contain and do has been investigated. Hardly anywhere in the food realm has more light been shed upon diet-mistakes than in the use of nuts. Their very use in nature would make them compact, concentrated foods, as seeds must be to nourish the living germ as it sprouts and becomes a plant. Then only is it equipped to take nutriment from nature's sources outside itself.
The wisdom of earlier peoples is usually carried longest by those whose resources are so limited that they cannot afford to lose what experience has taught others or to overlook what has been found good and cheap. Among such, nuts have continued in use as foods for nourishment. From them have come palatable nut-preparations, as cooked chestnuts (a starchy food of delicate flavor) and peanuts, a building and energy food. Many food-uses of nuts are now practiced, as grated nuts on thin soups and green salads to add what these lack.
Compare composition of nuts with that of other foods in table.
General Composition Of Common Foods
Water | % IN | Fat | CH | Ash | Protein |
2 - 10 | Nuts | 25-60 | I5-20 | 2-5 | 5-20+ |
40 - 60 | 15-20 | - | 1-15 | 15-20 | |
7 - 14 | Grains (dry) | 1-3 | 60 | 2-5 | 15-20+ |
80 - 90 | Vegetables and fruits | 1-2 | 3-85 | 2-5 | I-14 |
Produced Nut Foods
Nuts nourish. Though they build, they are principally energy-giving, due to large percentage of fat. Fat gives over twice as much heat-energy as the same quantity of carbohydrates. Nuts digest slowly; they need thorough mastication.
Study Of Composition Of Different Edible Nuts
Refuse | AS EATEN | ||||||
Water | Nuts (Shelled) | Fat | Carbohydrates | Ash | Protein | Nuts (Unshelled) | |
% | % | % | % | % | |||
32.6 | 1.6 | Peanuts (roasted) | 49.2 | 16.2 | 2.5 | 30.5 | |
- | 2. | Peanut butter | 46.6 | 17.1 | 5. | 29.3 | |
26.4 | 9.3 | Peanuts | 42. | 18.7 | 2.1 | 27.9 | |
- | 4.2 | Pistachio | 54.5 | 15.6 | 3.1 | 22.6 | |
64.8 | 4.8 | Almonds | 54.9 | 17-3 | 2. | 21. | |
58. | 2.8 | Walnuts | 64.4 | 14.8 | 1.3 | 16.7 | |
52.1 | 3.7 | Filberts | 65.3 | 13. | 2.4 | 15.6 | |
49.7 | 2.9 | Pecans | 70.8 | 14.3 | 1.7 | 10.3 | |
- | 3.5 | Coconut (shredded) | 57.3 | 31.6 | 1.3 | 6.3 | |
49.6 | 2.7 | 33.6 | 3.5 | 2. | 8.6 | Brazil-nuts | |
62.2 | 1.4 | 25.5 | 4.3 | .8 | 5.8 | Hickory-nuts | |
16.1 | 31. | 6.7 | 39. | 1.5 | 5.7 | Chestnuts | |
86.4 | .6 | 8.3 | •5 | •4 | 3.8 | Butternuts | |
48.8 | 7.2 | 25.9 | 14.3 | •9 | 2.9 | Coconuts | |
(Adapted from a government bulletin, "Nuts as Food")
Nut-cultivation is recent in the United States (California and Texas). In 1909 there were produced 62,328,000 pounds; increase of 57.7% in ten years. In 1909, value of crop was $4,448,000; increase of 128.1% in ten years. Walnuts (Persian or English), pecans, almonds, constituted nine tenths of nut crop. Walnut crops doubled in ten years; pecans tripled.
Nut-farms have multiplied rapidly in the United States.
(All data on crops are from "Abstract of the Census - Agriculture.")
Nut- And Fruit-Production In 1899-1909
In 1909 the United States produced fruits and nuts valued at $222,024,000. This was 4% of the total value of all farm crops. It was an advance of 66.9% over 1899, or a gain of $133,049,000.
Distribution of value of fruits and nuts in 1909 was:
Small fruits (strawberries, black-, dew-, and raspberries, gooseberries, currants, cranberries) | $29,974,000 |
Orchard fruits (apples, peaches, pears, plums, prunes, cherries, apricots, quinces) . .............. | 140,867,000 |
Grapes (all varieties)................... | 22,028,000 |
Citrus fruits (oranges, lemons, grapefruit, limes, tangerines, mandarins)....... | 22,711,000 |
Other tropical and subtropical fruits, as figs, olives (see below) ...................... | 1,995,000 |
Nuts (P.47).......................... | 4,448,000 |
Acreage for small fruits in 1909 was .1% of total improved farm acreage. Strawberries (most important of these), 1/2 of the small-fruit acreage and 3/4 of value.
Production of orchard fruits in 1909: 301,117,277 bearing trees; 216,084,000 bushels. California and New York led in these products, that are in value 2.6% of all products. Apples (most important product), 59.1% of value of orchard fruits.
Vine-culture in 1909 produced 223,702,000 bearing and 59,929,000 non-bearing vines. Production of grapes was 2,571,065,000 lb. Value .4% of all farm crops. California produced 2/3 of vines that yielded 3/4 of grape crop.
Citrus-fruit production increased 231.1% between 1899 and 1909 - from 7,098,000 boxes (1899) to 23,502,000 (1909). California raised 67.8%; Florida, 28.7%. No increase in production was equal to this of citrus-fruits. Grapefruit led with an increase of from 31,000 (1899) to 1,189,000 (1909).
Subtropical and other tropical fruits raised in California and Florida in small quantities are figs, olives, pineapples, bananas, pears (avocado), guavas, mangoes, persimmons (Japanese), loquats, pomegranates, dates. Olive crop (raised in Cal. and Ariz.) tripled from 1899 to 1909.
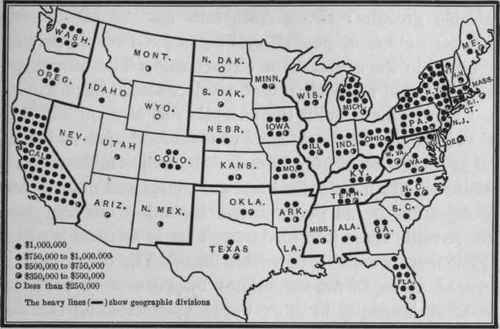
In United States. Farm-Fruit-Nut Crops
Fruits And Nuts Value By States - 1909
Cotton (Cottonseed-Oil) Acreage By States - 1909
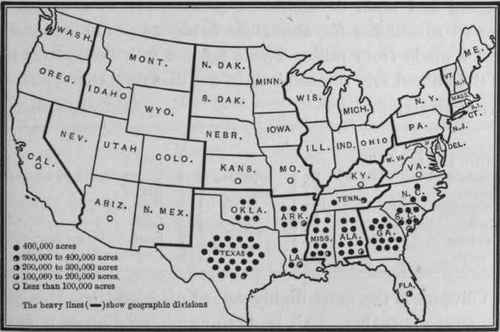
(From the Thirteenth Census of the United States, 1910)
Continue to:
My Books

