Starvation. Part 8
Description
This section is from the book "The Elements Of The Science Of Nutrition", by Graham Lusk. Also available from Amazon: The Elements of the Science of Nutrition.
Starvation. Part 8
The lowest average heat production of the fasting subject when in the bed calorimeter during the night was on the thir-tieth day, and amounted to 1025 calories calculated for a twenty-four-hour period, or 661 calories per square meter of surface (Du Bois Height-weight Formula).
During the fast the man lost 277 grams of nitrogen from his body. If one may estimate with Rubner that a man under conditions of normal nutrition contains 30 grams of nitrogen per kilogram of body weight, then the original nitrogen content of the subject was 1788 grams. A loss of 277 grams would represent 16 per cent. This loss occurred during a period when the heat production fell from 1441 to 1025
1 Abderhalden and Lampe: "Zeitschrift fur physiologische Chemie," 1912, lxxviii, 398.
2 Benedict, F. G.: "A Study of Prolonged Fasting," Carnegie Institution of Washington, 1915, Publication 203.
[NUTRITION LABORATORY OF THE CARNECIE INSTITUTION Of WASHINGTON. DOSTON, MASSACHUSETTS]
Metabolism Chart Of A Man Fasting 31 Days
April 14-May 15.1912
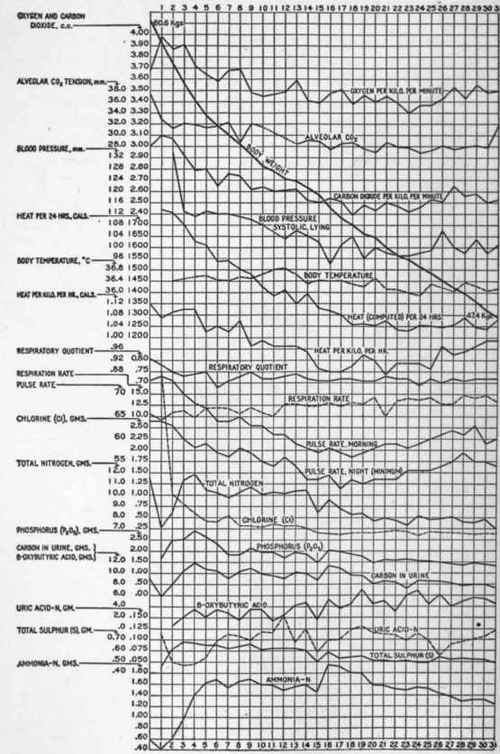
Fig 4.
Subject L. Height, 170.7 Cm. Only Distilled Water Was Taken During This Fast
Day of Fasting. | ||||
1st | 11th | 21 St | 31st | |
Body weight, kg ..................... | 59.6° | 53.88 | 50.49 | 47.39 |
Rectal temperature at 7 A.M ................. | 36.54 | 36.04 | 35.90 | |
Pulse.rate, morning, awake......... | 74 | 61 | 59 | 60 |
Hemoglobin in per cent ................ | 90 | 85 | 88 | 92 |
Alveolar CO2 tension (Haldane).... | 32.8 | 28.7 | 31.8* | |
Urine: Total solids............... | 43.51 | 42.05 | 31.88 | 27.07 |
Total N.................. | 7.10 | 10.25 | 7.93 | 6.94 |
Urea N................... | 5.68 | 7.66 | 5.54 | 4.84 |
Ammonia N .......................... | 0.41 | 1.58 | 1.57 | 1.24 |
Uric acid N ................ | 0.112 | 0.116 | 0.112 | 0.122 |
0.48 | 0.49 | 0.38 | 0.32 | |
Chlorin................... | 3.77 | 0.36 | 0.18 | 0.13 |
P2Os..................... | 1.66 | 1.95 | 1.60 | 1.32 |
N : P206.................. | 4.28 | 5.26 | 4.96 | 5.26 |
S........................ | 0.46 | 0.62 | 0.51 | 0.49 |
N:S..................... | 15.4 | 16.5 | 15.5 | 14.2 |
β.oxybutyric acid ............... | 1.4 | 5.0 | 4.5 | |
Ca....................... | 0.217 | 0.220 | 0.237 | 0.138 |
Mg...................... | 0.046 | 0.072 | 0.053 | 0.052 |
K........................ | 1.630 | 1.006 | 0.644 | 0.606 |
Na....................... | 2.070 | O.IOO | 0.066 | 0.053 |
C:N..................... | 0.820 | 0.936 | 1.083 | 1.062 |
Calories N................ | 9.15 | 10.73 | 11.98 | 11.53 |
Loss of flesh calculated from N loss. | 213 | 308 | 238 | 208 |
C02, night, c.c. per minute......... | 165 | 128 | 112 | "5 |
O2, night, c.c. per minute ................. | 212 | 176 | 154 | 160 |
R. Q., night...................... | 0.78 | 0.72 | o.73 | 0.72 |
H2O per hour ............. | 22.8 | 18.3 | 14.6 | 17.9 |
Per cent, of calories from protein... | 10.6 | 19.6 | 16.5 | 14.4 |
Calories, indirect, twenty.four hours' complete rest ............... | 1441 | 1193 | 1032 | 1072† |
Calories per square meter (DuBois), twenty.four hours............... | 843 | 732 | 653 | 701‡ |
Calories per kilogram, twenty.four hours ....................... | 24.2 | 22.1 | 20.4 | 22.6 |
* Previous day | = | 27.8. | † Previous day | = | 1025. | ‡ Previous day | = | 661 |
Calories, a reduction of 29 per cent. It is, therefore, evident ■that the fall in metabolism reaches greater proportions than does the fall in the mass of protoplasmic tissue.
There seems to be a specific reduction in metabolism coincident with undernutrition (see p. 476). Unfortunately, when food was taken after the fast digestive disturbances marred the records of this subject. It would have been interesting to ascertain whether his metabolism on the second or third day of food ingestion was normal according to the unit of surface.
Benedict calls attention to the fact that there is a parallelism between the amounts of magnesium and of nitrogen eliminated in the urine.
The following analysis of the derivation of the source of the mineral constituents in the urine of Benedict's subject L. may be made. Katz1 reports upon the quantities of the mineral constituents of human flesh, as obtained from a suicide on the day of death:
Mineral Analysis Of Fresh Human Muscle
Parts in 1000 | |||||||
K. | Na. | Fe. | Ca. | Mg. | P2O5 | cl. | s. |
3.20 | 0.80 | 0.15 | 0.075 | O.212 | 4.68 | 0.70 | 2.08 |
On this basis a calculation has been made of the mineral content of the "flesh" computed to have been destroyed on three different days in the fasting subject L., and these calculated values have been compared with the minerals actually excreted in the urines of these days. The following table presents these details:
Subject L. Estimated Salt Supply From "Flesh" Metabolized On The Assumption That This Was Muscle Tissue, Compared With The Loss Of Salts In The Urine
Day of Fast. | K. | Na. | Ca. | Mg. | P2O5. | CI. | S. | |
In 308 g, flesh ......... | 1I | 0.986 | 0.246 | 0.023 | 0.065 | 1.44 | 0.22 | 0.64 |
In urine ............. | 1.006 | O.IOO | 0.220 | 0.072 | 1.95 | 0.36 | 0.62 | |
Difference ............ | -0.020 | + 0.146 | -0.197 | -0.007 | -0.51 | -0.14 | +0.02 | |
In 238 g. flesh ............ | 22 | 0.762 | 0.190 | 0.018 | 0.050 | 1.11 | 0.17 | 0.50 |
In urine ............ | 0.643 | 0.066 | 0.237 | 0053 | 1.60 | 0.18 | 0.51 | |
Difference ............. | +0.119 | +0.124 | -0.219 | -0.003 | -0.49 | -O.OI | -0.01 | |
In 208 g. flesh ....... | 31 | 0.665 | 0.166 | 0.016 | 0.044 | 0.97 | 0.15 | 0.43 |
In urine ................ | 0.606 | 0.053 | 0.138 | 0.052 | 1.32 | 0.13 | 0.49 | |
Difference ............... | +0.059 | +0.113 | -0.122 | -0.008 | -0.3S | 1 + 0.02 | -0.06 |
1 Katz: "Pfluger's Archiv," 1896, lxiii, 1.
It is apparent that the quantities of potassium, magnesium, and sulphur eliminated in the urine are essentially those which might have been derived from the tissue destroyed. Sodium is constantly retained by the organism, whereas the loss of calcium and P2O5 represents osseous destruction. Since bones contain 24.48 per cent, of calcium and only 0.1 per cent, of magnesium, the loss of magnesium from this source would not be appreciable.
It seems clearly evident that the urinary waste of mineral constituents is largely composed of metabolized muscle or tissue analogous in composition to muscle, and of metabolized bone tissue.
It has already been set forth that the general metabolism is extremely even in fasting, and it may be added that existing evidence shows that the intermediary metabolism has a similar character. Thus Stiles and Lusk1 found in a fasting dog made diabetic with phlorhizin that whereas the quantity of nitrogen and sugar eliminated slowly fell, the ratio between the two (the Dextrose : Nitrogen or D : N ratio) remained constant. This is shown in the following table:
Constant Ratio Between Dextrose Production And N Elimination In Starvation
Period. | D per Hour. | N per Hour. | D :N. |
15 hours ............ | 2.61 | °.735 | 3.56 |
6 " ......................... | 0.720 | ||
3 " ......................... | • . . • | 0.683 | |
12 " ......................... | 2.39 | 0.666 | 3.60 |
3 " ......................... | 2.51 | 0.687 | 3.65 |
6 " ......................... | 0.670 | ||
3 " ........................ | 2.36 | 0.643 | 3.66 |
11 " ......................... | 2.32 | 0.642 | 3.62 |
The hour-to-hour sugar production from protein is therefore even and constantly proportional to the protein metabolism.
1 Stiles and Lusk: "American Journal of Physiology," 1903, x, 77.
The length of life under the condition of starvation gen-erally depends upon the quantity of fat present in the organism at the start. The quantity of fat and protein in an animal at the beginning of starvation or at any time during starvation may be estimated if the day-to-day metabolism be determined, and if the whole animal he analyzed for fat and protein at the time of Heath The sum of the quantities remaining in the body, and the quantity of waste of previous days, will give the composition of the animal at any definite date during the experiment. E. Voit1 shows that a rabbit with an original fat content of 7 per cent, lived nineteen days and lost 49 per cent, of his body protein. Another rabbit with an original fat content of only 2.3 per cent, lived but nine days, while the loss of body protein amounted to 35 per cent. At the death of these rabbits the amount of fat found was very small, and the general vitality toward the end was almost exclusively maintained by the combustion of protein. Other animals, however, which lost 22 to 26 per cent, of their protein contained considerable fat at the time of death (see table, p. 103). E. Voit finds that the-greater the amount of fat in the body, the less is the protein metabolisms In animals of equal fat content the relation between the amount of fat and the amount of protein oxidized in the cells in starvation is always the same. When there is, no fat, protein may burn exclusively. From this it follows that the quantity of the protein metabolism in starvation depends upon the amount of fat in the body.
Continue to:
My Books

