Size Of House Drains. Continued
Description
This section is from the book "Principles And Practice Of Plumbing", by John Joseph Cosgrove. Also available from Amazon: Principles and Practice of Plumbing.
Size Of House Drains. Continued
The per capita consumption of water in many of the New York State hospitals average at present from 150 to 200 gallons of water daily. In the principal cities throughout the United States the per capita daily consumption of water varies from 36 to 300 gallons, with an average from all the cities of 121 gallons. On the whole, it would seem that a per capita allowance of 100 gallons daily would be amply sufficient, and at the same time not too much. A study of Table V shows that in but few cities does the per capita supply fall much below 100 gallons daily, and in those cities that do (all of which are manufacturing cities), it is reasonable to suppose that a large percentage of the people do not use the city water. In the large cities, on the other hand, where from 150 to 300 gallons of water per capita are used daily, allowance must be made for water used for fire purposes, street sprinkling, flushing of sewers, etc., which would bring the average consumption of water within buildings for domestic purposes down to about 100 gallons per day. Of this 100 gallons, 45 per cent, will probably be used during one hour of the day, at the hour that people arise. It will be used as follows:
Water closets....... | 6 gallons |
Preparation of meals, etc. .... | 5 gallons |
Laving | 2 gallons |
Bathing | 32 gallons |
Total....... | 45 gallons |
Forty-five gallons per hour equals .75 of a gallon per minute; therefore, to find the amount of water to be removed by a house drain under the foregoing conditions, multiply the number of inmates the building is designed to accommodate by .75 of a gallon, and the product will be the quantity of water or sewage in U. S. gallons to be removed per minute. The size of pipe required to take care of this amount can then be found in Table IV or by the formula
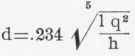
In which d=diameter of pipe in feet q=cubic feet of sewage delivered per second h=head in feet l=length of pipe in feet Example - What size house drain will be required in a hotel built to accommodate 300 guests and servants, the daily per capita allowance of water being 100 gallons, and the drain to be laid at a grade to produce a velocity of about 270 feet per minute ?
Solution
300X.75=225 gallons, or 225/7.5 =30 cubic feet of sewage per minute to be disposed of. From Table IV it is found that a 5-inch pipe, when laid at a grade of 1 to 70, will discharge about 31 cubic feet of water per minute. Solving the same problem by means of the formula, we have: q=30 cubic feet per minute, =.5 cubic feet per second, and q2 = .25; with the pipe laid at a grade of 1 to 70 we have
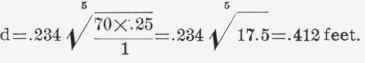 Therefore, d=.412X12=4.95 inches; say a 5-inch pipe.
The size of house drains in buildings is sometimes determined by the following empirical rule:
Rule: Allow one square inch in sectional area of the drain for each 2 cubic feet, or 15 U. S. gallons of sewage to be removed per minute.
Example
What size pipe will be required to remove 108 cubic feet of water per minute when the drain is laid at a grade to produce a velocity of about 270 feet per minute?
Solution
108/2=54 square inches area, and from Table VI it will be seen that a pipe of about 8 1/4 inches diameter has the required area. An 8-inch pipe, therefore, would be used.
Table V
Per capita daily water consumption in the fifty largest cities of the United States in 1890 and in 1900, arranged in order of population.* | ||||
Per Capita Consumption in Gallons | Increase or Decrease in Consumption in Ten Years in Gallons | |||
Cities | ||||
1890 | 1900 | Incr. | Decr. | |
1. +New York..... | 79 | 116 | 37 | .... |
2. Chicago..... | 140 | 190 | 50 | .... |
3. Philadelphia..... | 132 | 229 | 97 | ... |
4. +Brooklyn..... | 72 | .... | ■ ■ • • | ... |
5. St. Louis ..... | 72 | 159 | 87 | ... |
6. Boston...... | 80 | 143 | 63 | .... |
7. Baltimore..... | 94 | 97 | 3 | .... |
8. San Francisco .... | 61 | 73 | 12 | .... |
9. Cincinnati .... | 112 | 121 | 7 | .... |
10. Cleveland..... | 103 | 159 | 56 | .... |
11. Buffalo...... | 186 | 233 | 47 | .... |
12. New Orleans .... | #37 | #48 | 11 | ..... |
13. Pittsburgh..... | 144 | 231 | 87 | .... |
14. Washington ..... | 158 | 185 | 27 | .... |
15. Detroit...... | 161 | 146 | • • ■ • | 15 |
16. Milwaukee..... | 110 | 80 | • • • • | 30 |
17. Newark..... | 76 | 94 | 18 | .... |
18. Minneapolis..... | 75 | 93 | 18 | .... |
19. Jersey City..... 20. Louisville..... | 97 | 160 | 63 | .... |
74 | 100 | 26 | .... | |
21. Omaha | 94 | 176 | 82 | .... |
22. Rochester..... | 66 | 83 | 17 | .... |
23. St. Paul..... | 60 | 67 | 7 | ... |
24. Kansas City..... | 71 | 62 | 9 | .... |
25. Providence..... | 48 | 54 | 6 | .... |
26. Denver..... | • • • • | 300 | • • • a | .... |
27. Indianapolis..... | 71 | 79 | 8 | ... |
28. Allegheny..... | 230 | .... | .... | ... |
29. Albany..... | . . • • | 191 | .... | ... |
30. Columbus..... | 78 | 230 | 152 | ... |
* The classification is by the census of 1890, so as to include all the cities in the earlier grouping.
+ New York and Brooklyn consolidated since 1890
# Only a small part of the population supplied.
Table V - Continued
Per capita daily water consumption in the fifty largest cities of the United States in 1890 and in 1900, arranged in order of population.* | ||||
Cities | Per Capita Consumption in Gallons | Increase or Decrease in Consumption in Ten Years in Gallons | ||
1890 | 1900 | Incr. | Decr. | |
31. Syracuse..... | 68 | 102 | 34 | ... |
32. Worcester ..................... | 59 | 70 | 11 | ... |
33. Toledo ............................ | 72 | 119 | 37 | ... |
34. Richmond ...................... | 167 | 100 | • • • • | 67 |
35. New Haven ....................... | 135 | 150 | 15 | .... |
36. Paterson .......................... | 128 | 129 | 1 | ... |
37. Lowell .......................... | 66 | 85 | 19 | ... |
38. Nashville ....................... | 146 | 140 | • • • • | .6 |
39. Scranton ...................... | .... | _____ | • • • • | ..... |
40. Fall River .................... | 29 | 36 | 7 | ... |
41. Cambridge ....................... | 64 | 79 | 15 | ... |
42. Atlanta ........................... | 36 | 84 | 48 | ... |
43. Memphis ......................... | 124 | 125 | 1 | ... |
44. Wilmington .................... | 113 | 90 | • • • • | 23 |
45. Dayton ....................... | 47 | 62 | 15 | ... |
46. Troy ................... | 125 | 183 | 58 | ... |
47. Grand Rapids .................. | • • • | 156 | • • • • | ... |
48. Reading ................. | 75 | 92 | 17 | ... |
49. Camden ..................... | 131 | 280 | 149 | ... |
50. Trenton ............................ | 62 | 99.9 | 37 | ... |
* The classification is by the census of 1890, so as to include all the cities in the earlier grouping.
Continue to:
My Books

