Variety - Similarity. Diet-Composition
Description
This section is from the book "Food - What It Is And Does", by Edith Greer. Also available from Amazon: Food: What it is and Does.
Variety - Similarity. Diet-Composition
Foods, the edible parts of plants and animals, are composed of what these are. It is this that makes food capable of carrying into the body substances that sustain its life and activity. These substances (protein, fat, carbohydrates, mineral salts, water) are present in different quantities. This makes some foods able to take the place of others and some to add in combination what others lack.
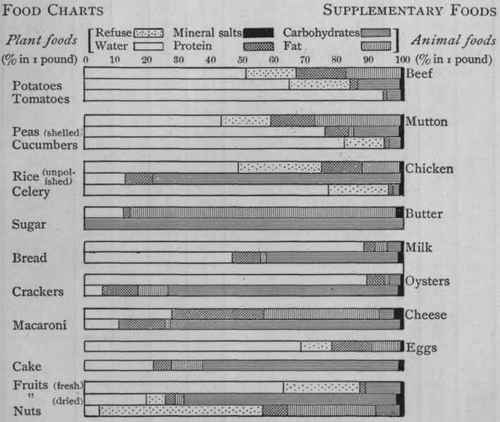
This comparison is of 1 lb. of each food, but foods, it should be remembered, are eaten in different quantities. This is somewhat controlled by their bulk when prepared. Potatoes 1 1/2 - 2 lb. is approximately the equivalent of 1/2-1 1/4 lb. rice as vegetable served with meat. Note their nutrients. Beef 1-11- lb. serves three. Butter for three for a day weighs 3/8 lb.
Diet Chart, p. 222 Calculation of Dietary, p. 223
Food-Composition Tables Animal Foods (As Purchased)
R | w | P | F | CH | MM | Calories | |
% | % | Beef, fresh | % | % | % | % | Per pound |
13 | 52 | Porterhouse | 19 | 18 | .8 | 1100 | |
64 | Rib rolls | 19 | 17 | •9 | 1055 | ||
7 | 61 | Round | 19 | 13 | I. | 890 | |
10 | 54 | Flank | 17 | 19 | •7 | 1105 | |
13 | 54 | Sirloin steak | 17 | 16 | •9 | 975 | |
16 | 57 | Shoulder clod | 16 | 10 | •9 | 715 | |
13 | 53 | Loin | 16 | 18 | •9 | 1025 | |
16 | 53 | Chuck ribs | 16 | 15 | .8 | 910 | |
28 | 46 | Neck | 15 | 12 | •7 | 1165 | |
21 | 44 | Ribs | 14 | 21 | •7 | 1135 | |
21 | 45 | Rump | 14 | 20 | •7 | 1090 | |
37 | 43 | Shank (fore) | 13 | 7 | .6 | 545 | |
19 | 49 | Fore quarter | 15 - | 18 | •7 | 995 | |
16 | 50 | Hind quarter | 15 + | 19 | •7 | 1045 | |
Canned, dried, etc. | |||||||
5 | 54 | Dried (salted) | 26 + | 7 | 9. | 790 | |
52 | Canned (corned) | 26 + | 19 | 4. | 1270 | ||
52 | (boiled) | 26- | 23 | 1. + | 1470 | ||
8 | 49 | Corned | 14 + | 24 | 5- | 1245 | |
6 | 59 | Tongue (pickled) | 12 - | 19 | 4. | 1010 | |
Veal | |||||||
3 | 68 | Leg cutlets | 20 | 8 | 1. | 695 | |
14 | 60 | Leg | 16 - | 8 | •9 | 625 | |
21 | 52 | Breast | 15 + | 11 | .8 | 745 | |
Mutton | |||||||
18 | 51 | Leg (hind) | 15 | 15 - | .8 | 890 | |
16 | 42 | Loin chops | 14 - | 28 | •7 | 1415 | |
10 | 39 | Flank | 14 - | 37 | .6 | 1770 | |
Lamb | |||||||
17 | 53 | Leg (hind) | 16 | 14 | •9 | 860 | |
19 | 46 | Breast | 15 | 19 | .8 | 1075 | |
Poultry | |||||||
23 | 42 | Turkey | 16 | 18 | .8 | 1060 | |
l8 | 39 | Goose | 13 | 30 | •7 | 1475 | |
26 | 47 | 14 - | 12 | •7 | 765 | ||
42 | 44 | Broilers | 13 - | 1 + | •7 | 305 | |
11 | 66 | 13 | 9 + | •9 | 635 |
R, refuse; W, water; P, protein; F, fat; CH, carbohydrates; MM, mineral salts. (Over -5 is considered 1; under .5 is dropped except for mineral salts; + means more; -, less)
What constituent gives animal foods high fuel value? For what are those of low heat value eaten?
Food-Composition Tables Animal Foods (As Purchased)
Calories | MM | CH | F | P | Animal Foods | W | R |
Per pound | % | % | % | % | Pork, fresh | % | % |
895 | 1. | 13 | 19 | Tenderloin | 67 | ||
1320 | .8 | 26 | 14- | Ham | 48 | 11 | |
1245 | .8 | 24 | 13 + | Loin chops | 42 | 20 | |
1450 | •7 | 30 | 12 | Shoulder | 50 | 12 | |
Salted, smoked | |||||||
1635 | 4« | 33 | 14 | Ham (smoked) | 35 | 14 | |
1335 | 6. | 27 | 13 | Shoulder (smoked) | 37 | 18 | |
2715 | 4. | 62 | 9 | Bacon (smoked) | 17 | 8 | |
3555 | 4.- | 86 | 2- | Salt pork | 8 | ||
Sausage | |||||||
"55 | 3.+ | 1 | 19 | 20 | Frankfort | 57 | |
1155 | 4. | 20 | 18 | Bologna | 55 | 3 | |
2075 | 2. | 1 | 44 | 13 | Pork | 40 | |
Soups | |||||||
365 | 1. | 6 | 4 | 5 | Meat stew | 85 | |
120 | 1. | 1 | 4 | Beef | 93 | ||
475 | •9 | 4 | 15 | Halibut | 62 | 18 | |
275 | •9 | 1 - | 13 | Perch (dressed) | 51 | 35 | |
220 | .8 | 11 | Cod (dressed) | 59 | 30 | ||
325 | 19. | 16 | Cod (salt) | 40 | 30 | ||
370 | •7 | 4 | 10 | Mackerel | 40 | 45 | |
380 | •7 | 5 | 9 | Shad (whole) | 35 | 50 | |
600 | 2. | 3- | 4 | 21 | Shad (roe) | 71 | |
755 | 7- | 9 | 21 | Herrings (smoked) | 19 | 44 | |
915 | 3- | 12 | 22 | Salmon (canned) | 64 | ||
95° | 5. | 12 | 24 | Sardines (canned) | 54 | 5 | |
340 | 2.+ | 5 | 1 | 11 - | Clams | 81 | |
200 | 2.- | 1 - | 1 - | 8 | Crabs | 37 | 52 |
145 | .8 | 1 - | 6 | Lobsters | 31 | 62 | |
225 | 1. | 3 | 1 | 6 | Oyster solids | 88 | |
3410 | 3. | 85 | 1 | Butter | 11 | ||
865 | •5 | 5- | 19 | 3- | Cream | 74 | |
310 | •7 | 5 | 4 | 3 | Milk (whole) | 87 | |
165 | •7 | 5 | 3 + | Skim milk | 91 | ||
160 | •7 | 5- | 1 - | 3 | Butter milk | 91 | |
1430 | 2. | 54 | 8 | 9- | Condensed milk | 30 | |
2075 | 4. | 4 | 37 | 28 | Cheddar cheese | 27 | |
1885 | 4.- | 2 + | 34 | 26 | Cream cheese | 34 |
(Rearranged from Farmer's Bulletin, No. 142, United States Department of Agriculture)
Which animal foods contain carbohydrates? In dairy products and fish they are forms of sugar.
Food-Composition Tables Vegetable Foods (As Purchased)
R | w | P | CH | MM | Calories | ||
% | % | % | % | % | % | Per Pound | |
10 | 12 | 2 - | 75 | 1.3 | 1680 | ||
14 | Buckwheat | 6 | 1 | 78 | •9 | 1605 | |
13 | Rye | 7 | I - | 79 | •7 | 1620 | |
13- | Cornmeal | 9 | 2- | 75 | 1. | 1635 | |
8 | Oatmeal | 17 | 7 | 66 | 2. | 1800 | |
12 | Rice | 8 | 79 | •4 | 1620 | ||
11 | Tapioca | 88 | .1 | 1650 | |||
90 | 1675 | ||||||
11 | Entire wheat | 14 | 2- | 72 | 1. | 1650 | |
11 | Graham | 13 | 2 + | 71 | 1.8 | 1645 | |
12 | White (high) | 11 | 1 | 75 | •5 | 1635 | |
12 | White (low) | 14 | 2 | 71 | •9 | 1640 | |
10 | Macaroni | 13 | 1 - | 74 | 1.3 | 1645 | |
Bread, etc. | |||||||
35 | White | 9 | 1 | 53 | 1.1 | 1200 | |
44 | Brown | 5 | 2- | 47 | 2.1 | 1040 | |
36 | Graham | 9 | 2- | 52 | 1.5 | 1195 | |
33 | Whole wheat | 10- | 1 | 50 | 1.3 | 1130 | |
36 | Rye | 9 | 1 - | 53 | 1.5 | 1170 | |
20 | 6 | 9 | 63 | 1.5 | 1630 | ||
Crackers | |||||||
7 | Cream | 10 | 12 | 70 | 1.7 | 1925 | |
5 | Oyster | 11 | 11 | 71 | 2.9 | 1910 | |
6 | Soda | 10 | 9 | 73 | 2.1 | 1875 | |
Sugar, etc. | 100 | 1750 | |||||
Molasses | 70 | 1225 | |||||
Candy | 96 | 1680 | |||||
Honey | 81 | 1420 | |||||
Maple sirup | 71 | 1250 | |||||
Starchy vegetables | |||||||
13 | Beans (dried) | 23 | 2- | 60 | 3.5 | 1520 | |
70 | Beans (baked) | 7 | 3 | 20 | 2.1 | 555 | |
69 | Beans (shelled) | 7 | 1 - | 22 | 1.7 | 540 | |
7 | 83 | Beans (string) | 2 | 7 | •7 | 170 | |
10 | Peas (dried) | 25 | 1 | 62 | 3. | 1565 | |
75 | Peas (shelled) | 7 | 1 - | 17 | 1. | 440 | |
85 | Peas (green) | 4 | 10 | 1.1 | 235 | ||
76 | Corn (green) | 3 | 1 - | 20 | •7 | 440 | |
76 | Succotash | 4 | 1 | 19 | •9 | 425 | |
20 | 63 | Potatoes | 2- | 15 | .8 | 295 | |
20 | 55 | Potatoes (sweet) | 1 + | 1 - | 22 | •9 | 440 |
20 | 66 | Parsnips | I + | 11 | 1.1 | 230 | |
10 | 79 | Onions | I + | 9 | •5 | 190 |
Food-Composition Tables Vegetable Foods (As Purchased)
Calories | MM | CH | F | P | Vegetable Foods | W | R |
Per pound | % | % | % | % | % | % | |
1775 | 1.5 | 19 | 29 | 20- | Peanuts | 7 | 25 |
1515 | 1.1 | 10- | 30 | 12- | Almonds | 3 | 45 |
1485 | 2. | 3.5 | 34 | 9- | Brazil | 3- | 50 |
1430 | 1.1 | 6 | 31 | 8- | Filberts | 2 | 52 |
730 | •5 | 3 | 15- | 7 | Walnuts (black) | 1 | 74 |
1250 | .6 | 7- | 27 | 7 | Walnuts (English) | 1 | 58 |
1145 | .8 | 4 | 26 | 6 | Hickory | 1 | 62 |
1465 | •7 | 6 | 33 | 5 | Pecans | 1 | 53 |
1295 | •9 | 14 | 30 | 3 | Coconuts | 7 | 49 |
2865 | 1.3 | 32 | 57 | 6 | Coconut (prepared) | 4 | |
385 | 4 | 1 - | 8 | 4 | Butternuts | 1 | 86 |
915 | 1.1 | 35 | 5- | 5 | Chestnuts | 38 | 16 |
Dried fruits | |||||||
1280 | 2.4 | 74 | 4 | Figs | 19 | ||
1275 | 1.2 | 71 | 3- | 2 | Dates | 14 | 10 |
1265 | 3. | 69 | 3 | 2 | Raisins | 13 | 10 |
1185 | 2. | 66 | 2 | 2 | Apples | 28 | |
1125 | 2.4 | 63 | 1 | 5- | Apricots | 29 | |
Fresh fruits | |||||||
295 | 4 | 14 | 1 | Grapes | 58 | 25 | |
260 | .6 | 14 | 1 - | Bananas | 49 | 35 | |
395 | 1.5 | 13 | Plums | 78 | |||
230 | •4 | 13 | 1 - | Pears | 76 | 10 | |
220 | .6 | 13- | Raspberries | 86 | |||
190 | 11 | Apples | 63 | 25 | |||
150 | •4 | 9- | 1 - | Oranges | 63 | 27 | |
150 | .6 | 7 | 1 - | Strawberries | 86 | 5 | |
125 | •4 | 6 | 1 - | 1 - | Lemons | 63 | 3° |
80 | 5 | Muskmelons | 45 | 5° | |||
5° | .1 | 3- | Watermelons | 38 | 59 | ||
Green Vegetables | |||||||
185 | 1.2 | 7- | 3.5 | Mushrooms | 88 | ||
160 | •9 | 8- | 1 + | Beets | 70 | 20 | |
155 | 1.1 | 7.5 | Carrots | 70 | 20 | ||
120 | .6 | 6- | Turnips | 63 | 30 | ||
100 | •4 | 5- | 1 - | Squash | 44 | 50 | |
"5 | •9 | 5 | 1 + | Cabbage | 78 | 15 | |
100 | •5 | 4 | 1 - | Tomatoes | 94 | ||
95 | .6 | 4 | Tomatoes (canned) | 94 | |||
95 | 2.1 | 3 | 2 | Spinach | 92 | ||
65 | .8 | 3- | Celery | 76 | 20 | ||
65 | •4 | 3- | 1 - | Cucumbers | 81 | 15 | |
65 | .8 | 3- | Lettuce | 81 | 15 | ||
60 | 4 | 2 | Rhubarb | 57 | 40 |
Continue to:
My Books

