Of Food. Food And Income
Description
This section is from the book "Food - What It Is And Does", by Edith Greer. Also available from Amazon: Food: What it is and Does.
Of Food. Food And Income
Compare amount of food for a man at sedentary work, a woman at moderate labor, boy 13-14, girl 15-16, and extreme old age.
Under what conditions will any one else need what a boy 15-16 eats ? Under what conditions will a woman, boy, and girl need what an aged person eats ?
How much food does a boy need at 12 ? a girl at 12 ? a boy at 10 ? a girl at 10 ? .
When do boys and girls need the same amount; when different ?
When does a child need 1/2 as much food as its mother ? as its father ?
How much more food does a boy 13-14 need than a child 2-5 ?
Distribution of Incomes ] | $1000 | $2200 | $3600 |
Food | 1/3 | 5/16 | 5/18 |
Rent | 1/6+ | 1/6+ | 1/6+ |
Maintenance of house | 1/6 | 3/16 | 1/6 |
Clothing | 1/6- | 1/6- | 1/6 |
All other expenses | 1/6 - | 1/6- | 2/9 |
(Write the above proportions as decimals) (For families of 5 : 2 adults ; 3 children)
How much in dollars does each family spend for food ? for rent, etc. ? for food a week ? Compare food expenditure with that given on page 156.
If the man at $1000 does heavy labor, and the one at $3600 sedentary work, how much more food would the former need ? If one mother does moderate work and the other light, what is the difference in the food-need ?
Will a family of girls or boys spend more on food ?
If each of the above families had a boy over 14, a girl under 12, a child of 8, and the father and mother do moderate work, what would each spend apiece for food a week ?
Try this with other families that you select yourselves.
Population Of United States - 1910 Age Distribution
Census, 1910 | Total | % | Men - Boys | Ratio | Women - Girls |
Total Population | 91,972,266 | 100. | 47,332,277 | 106 to 100 | 44,639,989 |
Under 5 yr. | 10,631,364 | 11.6 | 5,380,596 | 102.5 " 100 | 5,250,768 |
5 to 14 " | 18,867,772 | 20.5 | 9,525,876 | 102. " 100 | 9,341,896 |
15 " 24 " | 18,120,587 | 19.7 | 9,107,572 | 101. " 100 | 9,013,015 |
25 " 44 " | 26,809,875 | 29.1 | 14,054,482 | 110.2 " 100 | 12,755,393 |
45 " 64 " | 13,424,089 | 14.6 | 7,163,532 | 114.4 " 100 | 6,260,757 |
65 and over | 3,949,524 | 4.3 | 1,985,976 | 101.1 " 100 | 1,963,548 |
% Distribution by Ages of Men - Boys and Women - Girls | ||||||
Under 5 Yr. | 5 to 14 Yr. | 15 to 24 Yr. | 25 to 44 Yr. | 45 TO 64 Yr. | 65 AND OVER | |
Men - Boys | 11.4 | 20.I | I9.2 | 29.7 | 15.1 | 4.2 |
Women - Girls | 11.8 | 20.9 | 20.2 | 28.6 | 14. | 4.4 |
(Find similar percentages for different groups given on opposite page).
(From the Thirteenth Census of the United States, 1910)
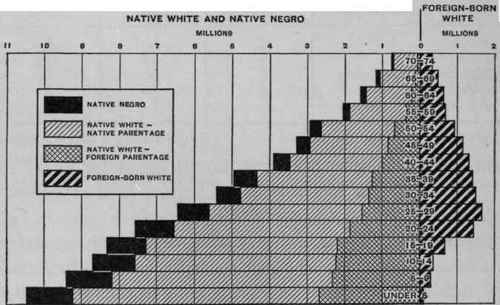
Compare percentages in diagram for 1910 with number of persons stated on opposite page.
Make a comparative chart of these percentages in both diagrams. Use heavy, solid black for 1910 and crossed lines for 1900.
Age - Race - Native - Foreign Composition Of Population
Census, 1910 | Total | % | Men - Boys | Ratio | Women - Girls |
Native white {native parentage) | |||||
49,488,575 | 100 | 25,229,218 | 104 to 100 | 24,259,357 | |
Under 5 yr. | 6,546,282 | 13.2 | 3,326,237 | 103.3 " 100 | 3,220,045 |
5 to 14 " | 11,185,298 | 22.6 | 5,669,886 | 102.8 " 100 | 5,515,412 |
15 " 24 " | 9.771,977 | 20.1 | 4,885,442 | 100. " 100 | 4,886,535 |
25 " 44 " | 12,946,441 | 26.I | 6,642,210 | 105.4 " 100 | 6,304,231 |
45 " 64 " | 6,740,000 | I3.6 | 3,547,325 | 111.1 " 100 | 3,192,675 |
65 and over | 2,201,068 | 4.4 | 1,089,349 | 98. " 100 | 1,111,719 |
Native white {foreign or mixed parentage) | |||||
18,897,837 | 100 | 9,425,239 | 99.5 to 100 | 9,472,598 | |
Under 5 yr. | 2,674,125 | 14.2 | 1,350,473 | 102. " 100 | 1,323,652 |
5 to 14 " | 4,551,444 | 24.1 | 2,289,629 | 101.2 " 100 | 2,261,815 |
15 " 24 " | 4,078,683 | 21.6 | 2,008,982 | 97.1 " 100 | 2,068,701 |
25 " 44 " | 5,210,109 | 27.6 | 2,644,475 | 97. " 100 | 2,644,475 |
45 " 64 " | 2,117,386 | 11.2 | 1,076,222 | 103.4 " 100 | 1,041,164 |
65 and over | 255,586 | 1.4 | 128,662 | 101.4 " 100 | 126,924 |
Foreign-born white | 13,345,545 | 100 | 7,523,788 | 129.2 to 100 | 5,821,757 |
Under 5 yr. | 102,507 | .8 | 51,940 | 102.7 " 100 | 50,567 |
5 to 14 " | 656,839 | 4.9 | 331,955 | 102.2 " 100 | 324,884 |
15 " 24 " | 2,104,142 | 15.8 | 1,175,674 | 126.6 " 100 | 928,468 |
25 " 44 " | 5,879,979 | 41.9 | 3,442,770 | 141.3 " 100 | 1,497,783 |
65 and over | 1,183,349 | 8.9 | 607,008 | 105.3 " 100 | 576,341 |
Negro | 9,827,763 | 100 | 4,885,881 | 98.9 to 100 | 4,941,882 |
Under 5 yr. | 1,263,288 | 12.9 | 629,320 | 99.3 " 100 | 633,968 |
5 to 14 " | 2,401,819 | 24.4 | 1,197,249 | 99.4 " 100 | 1,204,570 |
15 " 24 " | 2,091,211 | 21.3 | 990,102 | 89.9 " 100 | 1,101,109 |
25 " 44 " | 2,638,178 | 26.8 | 1,304,098 | 97.8 " 100 | 1,334,080 |
45 " 64 " | 1,108,103 | 11.3 | 595,554 | 116.2 " 100 | 512,549 |
65 and over | 294,124 | 3. | 152,482 | 107.7 " 100 | 141,642 |
Indian | 265,683 | 100 | 135,133 | 103.5 to 100 | 130,550 |
Under 5 yr. | 40,384 | 15.2 | 20,202 | 100.1 " 100 | 20,182 |
5 to 14 " | 67,934 | 25.6 | 34,548 | 103.5 " 100 | 33,386 |
15 " 24 " | 50,330 | 18.9 | 25,877 | 105.8 " 100 | 24,453 |
25 " 44 " | 60,175 | 22.6 | 30,840 | 105.1 " 100 | 29,335 |
45 " 64 " | 32,925 | 12.4 | 17,055 | 107.5 " 100 | 15,870 |
65 and over | 12,986 | 4.9 | 6,130 | 89.4 " 100 | 6,856 |
Chinese, Japanese, and all others | |||||
146,863 | 100 | 133,018 | 960.8 to 100 | 13,845 | |
Under 5 yr. | 4,778 | 3.3 | 2,424 | 103. " 100 | 2,354 |
5 to 14 " | 4,438 | 3. | 2,609 | 142.6 " 100 | 1,829 |
15 " 24 " | 24,244 | 16.5 | 21,495 | 781.9 " 100 | 2,749 |
25 "44 " | 74,993 | 51.1 | 68,930 | 1,136.9 " 100 | 6,063 |
45 " 64 " | 33,157 | 22.6 | 32,441 | 4,530.9 " 100 | 716 |
65 and over | 2,411 | 1.6 | 2,345 | Women less 100 than | 66 |
Production Of Food United States - 1909. Animal Foods
(From the Thirteenth Census of the United States, 1910)
Sold | Value | Ratio of Sales to Production | Price in 1909 | ||
Milk (gallons) | l,937,255,864 | $252,436,757 | (1909) | (1899) | 13¢ per gal. |
Cream " | 54,933,583 | 37,655,047 | 68.5¢ " " | ||
Butter fat (pounds) | 305,662,587 | 82,311,511 | % | % | |
Butter | 415,080,489 | 100,378,123 | 41.7 | 48.3 | 25¢ per lb. |
8,136,901 | 987,974 | 86.5 | 89.7 | 14¢ " " | |
Produced | Sold | Value | % Increase 1899 - 1909 (quantity) (cost) | ||
Eggs (doz). | 1,591,311,371 | 926,465,787 | $180,768,249 | 23% | 112.6 |
All fowls | 488,468,354 | 153,600,169 | 75,273,524 | 48. | |
All Domestic Animals, in 1909, $5,296,421,619 (Total Value).
Number | Value | Av. Per Head | On Farms | Not on Farms | |
Cattle | 63,682,648 | $1,560,339,868 | $24.50 | $24.26 | $32.37 |
Sheep | 52,838,748 | 234,664,528 | 4.44 | 444 | 4.66 |
Goats | 3,029,795 | 6,542,172 | 2.16 | 2.12 | 3.19 |
Swine | 59,473,636 | 409,414,568 | 6.88 | 6.86 | 7.82 |
States Leading In Number Of Animals On Farms, 1910
1 | All Cattle | Dairy Cows | Swine | Sheep and Goats |
Texas | New York | Iowa | Wyoming | |
2 | Iowa | Wisconsin | Illinois | Montana |
3 | Kansas | Iowa | Missouri | Ohio |
4 | Nebraska | Minnesota | Indiana | New Mexico |
5 | Wisconsin | Illinois | Nebraska | Idaho |
6 | Missouri | Texas | Ohio | Texas |
7 | Illinois | Pennsylvania | Kansas | Oregon |
8 | New York | Ohio | Texas | California |
9 | Minnesota | Missouri | Oklahoma | Michigan |
10 | California | Michigan | Wisconsin | Missouri |
Are these the states indicated on the maps on pp. 122-125?
Which state ranks highest in several products? What are the products?
What articles besides food will be produced in the states raising animals?
And Value In United States - 1909 Production Of Food
(From the Thirteenth Census of the United States, 1910) VEGETABLE FOODS.
Produced | Value | % Increase 1899-1909 | Price in 1909 | ||
Amount | Value | ||||
Corn (bu). | 2,552,189,630 | $1,438,553,919 | 737 | 8l.5 | 56¢ per bu. |
683,379,259 | 657,656,801 | 77.8 | 71.3 | 96¢ " " | |
Buckwheat " | 14,849,332 | 9,330,592 | 62.3 | 22.8 | 62 + ¢ " " |
Barley- | 173,044,212 | 92,458,571 | 122.1 | 53.3 | 53¢ " " |
Rye | 29,520,457 | 20,421,812 | 66.2 | 43.9 | 69¢ " " |
Rice (rough) " | 21,838,580 | 16,019,607 | 153.1 | 4.3 | 73¢ " " |
Potatoes | 389,194,965 | 166,423,910 | 69.2 | 18.8 | 43-¢ " " |
Sweet | 59,232,070 | 35,429,176 | 78.3 | 28. | 60-¢ " " |
Beans | 11,251,160 | 21,771,482 | 185.2 | 1.93 | 28¢ " " |
Peas | 7,129,294 | 10,963,739 | 38.6 | 1.53 | 83 + ¢ " " |
All other Sugar (tons) | 216,257,068 61,648,942 | 79.8 89.1 | |||
11,820,379 | •57 | $5.61 per ton | |||
Berries (qt). | 426,565,863 | 29,974,481 | 19.8 | 30. | 7¢ " qt. |
Orchard (bu). | 216,083,695 | 140,867,347 | 68.2 | 65.3 | 65¢ " bu. |
Tropical,etc. " | 8,227,838 | 200.3 | |||
Nuts (lb). | 62,328,010 | 1,949,931 | 128.1 | 46.5 | 7¢ " qt. |
Peanuts " | 19,415,816 | 18,271,929 | 151.3 | •9 | 55 - ¢ " bu. |
Cottonseed (tons) | 5,324,634 | 121,076,984 | 157.9 | 34.2 | $22.73 " ton |
Total crops increased from 1899 to 1909 in value 66.6%.
Note which crops have increased. Where are they grown? (See maps, pp. 18-19).
Note prices of large-quantity sales. Compare these prices with current local retail prices.
Estimate for winter wheat crop in the United States for 1914 is 551,000,000 bushels or 11.5% more than average for 10 years past. During this period 36,506,000 acres under wheat cultivation were abandoned.
All information necessary for a complete, exact computation of food consumed in the United States is not available.
For importations of food, see p. 158.
French consumption of food has been calculated. (See p. 159).
Continue to:
My Books

