Summary Of Progress Of The United States In Its Area, Population, and Industries
Description
This section is from the book "Scientific American Reference Book. A Manual for the Office, Household and Shop", by Albert A. Hopkins, A. Russell Bond. Also available from Amazon: Scientific American Reference Book.
Summary Of Progress Of The United States In Its Area, Population, and Industries
Area, Population, and Industries. | In | 1800. | 1850. |
Interest on public debt. | Dollars........... | 3,402,601 | 3,782,393 |
Pensioners. | Number.......... | ||
Total | Dollars. . . . | 91,252,768 | 173,509,526 |
Per capita1 | Dollars. . . . | 17.19 | 7.48 |
Exports of Merchandise: | |||
Total | Dollars. . . . | 70,971,780 | 144,375,726 |
Per capita 2 | Dollars. . . . | 13.37 | 6.23 |
Imports of Gold and Silver: | |||
Gold. | Dollars. . . . | 1,776,706 | |
Silver. | Dollars. . . . | 2,852,086 | |
Exports of Gold and Silver: | |||
Gold3 | Dollars. . . . | 4,560,627 | |
Silver 3 | Dollars. . . . | 2,962.367 | |
Imports for Consumption, Grouped According to Degree of Manufacture and Uses: | |||
Food and live animals. | Dollars. . . . | 32,718,076 | |
Per cent of total. | 18.86 | ||
Crude articles for domestic industries. | Dollars. . . . | 18,105,147 | |
Per cent of total. | 10.44 | ||
Articles manufactured wholly or partially for use as materials in the mechanic arts.............................. | Dollars. . . . | 30,857,522 | |
Per cent of total. | 17.78 | ||
Articles manufactured ready for consumption | Dollars. . . . | 65,887,552 | |
Per cent of total. | 37.97 | ||
Articles of voluntary use, luxuries, etc | Dollars. . . . | 25,941,229 | |
Per cent of total. | 14.95 | ||
Total imports | Dollars. . . . | 173,509,528 | |
Domestic Merchandise Exported, Grouped According to Sources of Production: | |||
Agricultural products. | Dollars. . . . | 25,590,534 | 108,605,713 |
Per cent of total. | 80.37 | 80.51 | |
Manufactures. | Dollars.... | 2,493,755 | 17,580,456 |
Per cent of total. | 7.83 | 13.03 | |
Mining | 167,090 | ||
Per cent of total. | 0.12 | ||
Forest | Dollars.... | 2,228,863 | 4,590,747 |
Per cent of total. | 7.00 | 3.40 | |
Fisheries. | Dollars.... | 1,098,511 | 2,824,818 |
Per cent of total. | 3.45 | 2.10 | |
Dollars.... | 429,240 | 1,131,409 | |
Per cent of total. | 1.35 | 0.84 | |
Total domestic exports. | Dollars. . . . | 31,840,903 | 134,900,233 |
Imports by Grand Divisions of The World: 4 | |||
Europe | Dollars.... | 46,857,960 | 124,954,302 |
Per cent of total. | 51.35 | 70.14 | |
North America. | Dollars.... | 32,116,092 | 24,136,879 |
Per cent of total. | 35.19 | 13.55 | |
South America. | Dollars. . . . | 16,647,637 | |
Per cent of total. | 9.35 | ||
Asia. | Dollars.... | 11,560,810 | 10,315,486 |
Per cent of total. | 12.67 | 5.79 | |
Oceania 5 | Dollars.... | 142,969 | 1,401,340 |
Per cent of total. | 0.16 | 0.79 | |
Africa | Dollars.... | 551,496 | 682,151 |
Per cent of total. | 0.60 | 0.38 | |
Exports by Grand Divisions of the World: 5. . | |||
Europe | Dollars.... | 41,348,088 | 113,862,253 |
Per cent of total. | 58.26 | 74.96 | |
North America. | Dollars. . . . | 27,208,618 | 24,722,610 |
Per cent of total. | 38.34 | 16.27 |
1 Based on total imports to 1860; after that on imports for consumption only.
2 Based on total exports to 1860; after that on domestic exports only.
3 Gold and silver cannot be separately stated in domestic exports before 1864, but it is probable that the greater portion of the exports was gold. Gold and silver contained in ore are included under gold and silver since 1894.
1860. | 1870. | 1880. | 1890. | 1900. | 1903. |
3,144,121 | 129,235,498 | 95,757,575 | 36,099,284 | 40,160,333 | 28,556,349 |
8,636 | 198,686 | 250,802 | 537,944 | 993,529 | 996,585 |
353,616,119 | 435,958,408 | 667,954,746 | 789,310,409 | 849,941,184 | 1,025,719,237 |
11.25 | 11.06 | 12.51 | 12.35 | 10.88 | 12.54 |
333,576,057 | 392,771,768 | 835,638,658 | 857,828,684 | 1,394,483,082 | 1,420,141,679 |
10.61 | 9.77 | 16.43 | 13.50 | 17.96 | 17.32 |
2,508,786 | 12,056,950 | 80,758,396 | 12,943,342 | 44,573,184 | 44,982,027 |
6,041,349 | 14,362,229 | 12,275,914 | 21,032,984 | 35,256,302 | 24,163,491 |
58,446,039 | 33,635,962 | 3,639,025 | 17,274,491 | 48,266,759 | 47,090,595 |
8,100,200 | 24,519,704 | 13,503,894 | 34,873,929 | 56,712,275 | 44,250,259 |
78,338,514 | 139,213,092 | 199,165,963 | 288,600,646 | 216,107,303 | 212,057,293 |
22.15 | 32.65 | 31.72 | 32.13 | 26.02 | 21.04 |
61,570,477 | 66,909,565 | 160,055,876 | 178,435,512 | 299,351,033 | 383,634,293 |
17.41 | 15.69 | 25.52 | 23.06 | 36.04 | 38.06 |
31,939,551 | 53,658,296 | 73,186,963 | 84,700,568 | 80,575,042 | 97,194,094 |
9.03 | 12.59 | 11.66 | 10.94 | 9.70 | 9.64 |
123,741,654 | 119,298,235 | 130,004,643 | 154,469,354 | 130,577,155 | 169,259,497 |
35.00 | 27.98 | 20.72 | 19.96 | 15.72 | 16.79 |
58,025,923 | 47,266,822 | 65,141,826 | 107,468,732 | 103,908,719 | 145,814,933 |
16.41 | 11.09 | 10.38 | 13.91 | 12.51 | 14.47 |
353,616,119 | 426,346,010 | 627,555,271 | 773,674,812 | 830,519,252 | 1,007,960,110 |
256,560,972 | 361,188,483 | 685,961,091 | 629,820,808 | 835,858,123 | 873,322,882 |
81.13 | 79.35 | 83.25 | 74.51 | 60.98 | 62.73 |
40,345,892 | 68,279,764 | 102,856,015 | 151,102,376 | 433,851,756 | 407,526,159 |
12.76 | 15.00 | 12.48 | 17.87 | 31.65 | 29.28 |
999,465 | 5,026,111 | 5,863,232 | 22,297,755 | 37,843,742 | 39,311,239 |
0.31 | 1.10 | 0.71 | 2.64 | 2.76 | 2.81 |
10,299,959 | 14,897,963 | 17,321,268 | 29,473,084 | 52,218,112 | 57,835,896 |
3.26 | 3.27 | 2.11 | 3.49 | 3.81 | 4.16 |
4,156,480 | 2,835,508 | 5,255,402 | 7,458,385 | 6,326,620 | 7,805,538 |
1.31 | 0.62 | 0.64 | 0.88 | 0.46 | 0.56 |
3,879,655 | 2,980,512 | 6,689,345 | 5,141,420 | 4,665,218 | 6,429,588 |
1.23 | 0.66 | 0.81 | 0.61 | 0.34 | 0.46 |
316,242,423 | 455,208,341 | 823,946,353 | 845,293,828 | 1,370,763,571 | 1,392,231,302 |
216,831,353 | 249,540,283 | 370,821,782 | 449,987,266 | 440,567,314 | 547,226,887 |
59.87 | 53.98 | 55.52 | 57.14 | 51.84 | 53.35 |
75,082,583 | 126,544,611 | 130,077,225 | 148,368,706 | 130,035,221 | 189,736,475 |
20.73 | 27.42 | 19.47 | 18.84 | 15.30 | 18.49 |
35,992,719 | 43,596,045 | 82,126,922 | 90,006,144 | 93,666,774 | 107,428,323 |
9.94 | 9.41 | 12.30 | 11.43 | 11.02 | 10.48 |
26,201,603 | 31,413,378 | 67,008,793 | 67,506,833 | 139,842,330 | 147,702,374 |
7.24 | 6.78 | 10.02 | 8.57 | 16.45 | 14.40 |
3,495,226 | 1,423,212 | 6 14,130,604 | 28,356,568 | 34,611,108 | 21,043,527 |
0.96 | 0.31 | 2.13 | 3.60 | 4.07 | 2.05 |
3,798,518 | 7 9,860,058 | 3,789,420 | 3,321,477 | 11,218,437 | 12,581,651 |
1.05 | 2.10 | 0.56 | 0.42 | 1.32 | 1.23 |
310,272,818 | 420,184,014 | 719,433,788 | 683,736,397 | 1,040,167,763 | 1,029,256,657 |
77.54 | 79.35 | 86.10 | 79.74 | 74.60 | 72.48 |
53,325,937 | 68,962,006 | 69,437,783 | 94,100,410 | 187,594,625 | 215,482,769 |
13.33 | 13.03 | 8.31 | 10.98 | 13.45 | 15.16 |
4 In 1870 specie is included in totals, but excluded in following years.
5 Hawaiian Islands not included since 1900.
6 Includes "All other Spanish possessions."
7 Includes "All other countries."
Area, Population, and Industries. | In | 1800. | 1850. | ||
Exports by Grand Divisions of the World - Cont'd. | |||||
South America | Dollars. . . . | 9,076,724 | |||
Per cent of total | 5.98 | ||||
Asia | Dollars. . . . | 1,177,846 | 3,051,720 | ||
Per cent of total | 1.66 | 2.01 | |||
Oceania1. | Dollars. . . . | 14,112 | 208,129 | ||
Per cent of total | 0.02 | 0.14 | |||
Africa. | Dollars. . . . | 1,110,374 | 977,284 | ||
Per cent of total | 1.56 | 0.64 | |||
Transportation of Foreign Commerce: | |||||
Imports - | |||||
By sea | In American vessels. | Dollars.... | 139,657,043 | ||
In foreign vessels. | Dollars. . . . | 38,481,275 | |||
Total. | Dollars. . . . | 178,138,318 | |||
Share carried in American vessels. | Per cent........ | 78.4 | |||
By land vehicles | Dollars. . . . | ||||
Total by land and sea. | Dollars.... | 178,138,318 | |||
Exports - | |||||
By sea | In American vessels. | Dollars.... | 99,615,041 | ||
In foreign vessels. | Dollars.... | 52,283,679 | |||
Total. | Dollars.... | 151,998,720 | |||
Share carried in American vessels. | Per cent......... | 65.4 | |||
By land vehicles | Dollars.... | ||||
Total by land and sea. | Dollars.... | 151,998,720 | |||
Foreign Commerce of Principal Customs Districts : | |||||
Boston.......................... | Imports. . . . | Dollars.... | |||
Exports. . . . | Dollars.... | ||||
New York...................... | Imports. . . . | Dollars.... | |||
Exports. . . . | Dollars.... | ||||
Philadelphia.................. | Imports. . . . | Dollars.... | |||
Exports. . . . | Dollars.... | ||||
Baltimore | Imports. . . . | Dollars.... | |||
Exports. . . . | Dollars.... | ||||
New Orleans. | Imports. . . . | Dollars.... | |||
Exports. . . . | Dollars.... | ||||
San Francisco | Imports. . . . | Dollars.... | |||
Exports. . . . | Dollars.... | ||||
Farm Statistics: | |||||
Farms | Number..... | 1,449,073 | |||
Persons engaged in agriculture. | Number.......... | ||||
Value of farms and farm property. | Dollars......... | 3,967,343,580 | |||
Value of farm products. | Dollars......... | ||||
Farm Animals: | |||||
Total value. | Dollars......... | 544,180,516 | |||
Cattle. | Number....... | 17,778,907 | |||
Number....... | 4,336,719 | ||||
Sheep. | Number....... | 21,773,220 | |||
Mules.............. | Number....... | 559,331 | |||
Swine | Number....... | 30,354,213 | |||
Production of Principal Commodities: | |||||
Wool | Pounds......... | 52,516,959 | |||
Wheat | Bushels.. | 100,485,944 | |||
Corn. | Bushels.. | 592,071,104 | |||
Cotton | Bales........ | 155,556 | 2,333,718 | ||
Cane-sugar. | Tons...... | 110,526 | |||
Production of Principal Minerals: | |||||
Precious metals - | |||||
Gold | Dollars.......... | 50,000,000 | |||
Silver | Dollars.......... | 50,000 | |||
Coal 6 | Tons............ | 3,358,899 | |||
Petroleum | Gallons......... | ||||
Pig iron | Tons...... | 563,755 | |||
1 Hawaiian Islands not included since 1900.
2 Includes "All other Spanish possessions."
3 Includes "All other countries."
4 Gold values.
5 Does not include value of products fed to live stock.
1860. | 1870. | 1880. | 1890. | 1900. | 1903. |
16,742,100 | 21,651,459 | 23,190,220 | 38,752,648 | 38,945,763 | 41,137,872 |
4.18 | 4.09 | 2.77 | 4.52 | 2.79 | 2.90 |
11,067,921 | 10,972,064 | 11,645,703 | 19,696,820 | 64,913,807 | 58,359,016 |
2.77 | 2.07 | 1.39 | 2.30 | 4.66 | 4.11 |
5,373,497 | 4,334,991 | 2 6,846,698 | 16,460,269 | 43,391,275 | 37,468,512 |
1.34 | 0.82 | 0.82 | 1.92 | 3.11 | 2.64 |
3,227,760 | 3 3,414,768 | 2 5,084,466 | 4,613,702 | 19,469,849 | 38,436,853 |
0.84 | 0.64 | 0.61 | 0.54 | 1.79 | 2.71 |
228,164,855 | 153,237,077 | 149,317,368 | 124,948,948 | 104,304,940 | 123,666,832 |
134,001,399 | 309,140,510 | 503,494,913 | 623,740,100 | 701,223,735 | 835,844,210 |
362,166,254 | 462,377,587 | 652,812,281 | 748,689,048 | 805,528,675 | 959,511,042 |
63.0 | 33.1 | 22.9 | 16.7 | 12.9 | 12.9 |
15,142,465 | 40,621,361 | 44,412,509 | 66,208,195 | ||
362,166,254 | 462,377,587 | 667,954,746 | 789,310,409 | 849,941,184 | 1,025,719,237 |
279,082,902 | 199,732,324 | 109,029,209 | 77,502,138 | 90,779,252 | • 91,028,200 |
121,039,394 | 329,786,978 | 720,770,521 | 747,376,644 | 1,193,220,689 | 1,190,262,178 |
400,122,296 | 529,519,302 | 829,799,730 | 824,878,782 | 1,283,999,941 | 1,281,290,378 |
70.0 | 37.7 | 13.1 | 9.4 | 7.1 | 7.1 |
5,838,928 | 32,949,902 | 110,483,141 | 138,851,301 | ||
400,122,296 | 529,519,302 | 835,638,658 | 857,828,684 | 1,394,483,082 | 1,420,141,679 |
39,333,684 | 47,484,060 | 68,503,136 | 62,876,666 | 72,195,939 | 86,310,586 |
12,747,945 | 14,126,429 | 59,238,241 | 71,201,944 | 112,195,555 | 88,126,444 |
231,310,086 | 281,048,813 | 459,937,153 | 516,426,693 | 537,237,282 | 618,705,662 |
80,047,978 | 196,614,746 | 392,560,090 | 349,051,791 | 518,834,471 | 505,829,694 |
14,611,934 | 14,483,211 | 35,944,500 | 53,936,315 | 51,866,002 | 59,995,431 |
5,526,967 | 16,927,610 | 49,649,693 | 37,410,683 | 78,406,031 | 73,531,968 |
9,781,205 | 19,512,468 | 19,945,989 | 13,140,203 | 19,045,279 | 27,803,167 |
8,940,100 | 14,510,733 | 76,253,566 | 73,983,693 | 115,530,378 | 81.704,497 |
20,636,316 | 14,377,471 | 10,611,353 | 14,658,163 | 17,490,811 | 28,880,744 |
108,164,812 | 107,586,952 | 90,442,019 | 108,126,891 | 115,858,764 | 149,072,519 |
7,367,016 | 15,982,549 | 35,221,751 | 48,751,223 | 47,869,628 | 36,454,283 |
4,868,090 | 13,991,781 | 32,358,929 | 36,876,091 | 40,368,288 | 33,502,616 |
2,044,077 | 2,659,985 | 4,008,907 | 4,564,641 | 5,739,657 | |
5,922,471 | 7,713,875 | 8,565,926 | 10,438,219 | ||
7,980,493,060 | 4 8,944,857,749 | 12,180,501,538 | 16,082,267,689 | 20,514,001,838 | |
4 1,958,030,927 | 2,212,540,927 | 2,460,107,454 | 5 3,764,177,706 | ||
1,089,329,915 | 1,524,960,149 | 1,576,917,556 | 2,418,766,028 | 2,228,123,134 | 3,102,515,540 |
25,616,019 | 25,484,100 | 33,258,000 | 52,801,907 | 43,902,414 | 61,764,433 |
6,249,174 | 8,248,800 | 11,201,800 | 14,213,837 | 13,537,524 | 16,557,373 |
22,471,275 | 40,853,000 | 40,765,900 | 44,336,072 | 41,883,065 | 63,964,876 |
1,151,148 | 1,179,500 | 1,729,500 | 2,331,027 | 2,086,027 | 2,728,088 |
33,512,867 | 26,751,400 | 34,034,100 | 51,602,780 | 37,079,356 | 46,922,624 |
60,264,913 | 162,000,000 | 232,500,000 | 276,000,000 | 288,636,621 | 287,450,000 |
173,104,924 | 235,884,700 | 498,549,868 | 399,262,000 | 522,229,505 | 637,821,835 |
838,792,740 | 1,094,255,000 | 1,717,434,543 | 1,489,970,000 | 2,105,102,516 | 2,244,176,925 |
4,861,292 | 3,114,592 | 5,761,252 | 7,311,322 | 9,433,416 | 10,727,559 |
119,040 | 46,800 | 92,802 | 136,503 | 149,191 | 293,397 |
46,000,000 | 50,000,000 | 36,000,000 | 32,845,000 | 79,171,000 | 74,425,340 |
150,000 | 16,000,000 | 39,200,000 | 70,485,714 | 74,533,495 | 73,076,106 |
18,513,123 | 32,863,000 | 63,822,830 | 140,866,931 | ||
7 21,000,000 | 220,951,290 | 1,104,017,166 | 1,924,552,224 | 2,661,233,568 | |
821,223 | 1,665,179 | 3,835,191 | 9,202,703 | 13,789,242 | 18,009,252 |
6 Pennsylvania anthracite shipments only from 1820 to 1867; entire coal product from 1868 to 1902.
7 In addition to this it is estimated that 10,000,000 barrels ran to waste in and prior to 1862 for want of a market.
Area, Population, and Industries. | In | 1800. | 1850. |
Tons.. | |||
Copper. | Tons.. | 650 | |
Total value all mineral production in U. S. | Dollars | ||
Manufacturing Industries of the U. S.: | |||
Manufacturing establishments 1. | Number | 123,025 | |
Average employees 1 | Number | 957,059 | |
Wages and salaries paid 1 | Dollars | 236,755,464 | |
Value of products 1 | Dollars | 1,019,106,616 | |
Manufactures of Iron and Steel: 1 | |||
Establishments. | Number | ||
Wages and salaries paid. | Dollars | ||
Value of products. | Dollars | ||
Imports. | Dollars | 20,145,067 | |
Exports | Dollars | 52,144 | 1,953,702 |
Tin Plates: | |||
Imports. | Pounds | ||
Production. | Lbs., net | ||
Manufactures of Cotton:3 | |||
Establishments 3 | Number | 1,094 | |
Wages and salaries paid 1. | Dollars | ||
Value of products 1 | Dollars | 61,869,184 | |
Exports. | Dollars | 4,734,424 | |
Imports. | Dollars | 20,108,719 | |
Cotton Movement: | |||
Domestic cotton taken by United States mills | Bales......... | 595,000 | |
Exports of domestic cotton. | Pounds | 635,381,607 | |
Dollars | 71,984,616 | ||
Raw cotton imported. | Pounds | 4,239,987 | 269,114 |
Manufactures of Wool: 3 | |||
Establishments l. | Number | 1,675 | |
Wages and salaries paid 1. | Dollars | ||
Value of products 1 | Dollars | 48,608,779 | |
Imports. | Dollars | 19,620,619 | |
Raw wool imported. | Pounds | 18,695,294 | |
Manufactures of Silk: | |||
Establishments 1 | Number | 67 | |
Wages and salaries paid 1 | Dollars | ||
Value of products 1 | Dollars | 1,809,476 | |
Imports. | Dollars | 17,639,624 | |
Raw silk imported. | Pounds | ||
Imports of crude rubber. | Pounds | ||
Sugar: | |||
Imports. | Pounds | 218,430,764 | |
Dollars | 7,555,603 | ||
Average cost per pound in foreign countries. | Cents......... | 3.46 | |
Wholesale prices of granulated, at New York | Cents......... | ||
Total consumption | Tons. . | 239,409 | |
Consumption per capita. | Pounds | 23.1 | |
Coffee : | |||
Imports. | Pounds | 145,272,687 | |
Dollars | 11,234,835 | ||
Average import price per pound at New York. | Cents......... | 7.6 | |
Consumption per capita 6. | Pounds | 5.60 | |
Tea: | |||
Imports. | Pounds | 29,872,654 | |
Dollars | 4,719,232 | ||
Average import price per pound at New York. | Cents..... | 14.1 | |
Consumption per capita 6. | Pounds | 1.22 | |
Railways: | |||
In operation. | Miles.......... | 9,021 | |
Number | |||
Freight carried one mile. | Tons.. |
1 No official figures in other than census years.
2 1891, last six months.
3 Does not include hosiery and knit goods.
1860. | 1870. | 1880. | 1890. | 1900. | 1903. |
68,750 | 1,247,335 | 4,277,071 | 10,188,329 | ||
7,200 | 12,600 | 27,000 | 115,966 | 270,588 | |
218,598,994 | 369,319,000 | 619,648,925 | 1,063,620,548 | ||
140.433 | 252,148 | 253,852 | 355,415 | 512,734 | |
1,311,246 | 2,053,996 | 2,732,595 | 4,712,622 | 5,719,137 | |
378,878,966 | 775,584,343 | 947,953,795 | 2,283,216,529 | 2,735,430,848 | |
1,885,861,676 | 4,232,325,442 | 5,369,579,191 | 9,372,437,283 | 13,039,279,566 | |
808 | 1,005 | 719 | 725 | ||
40,514,981 | 55,476,785 | 95,736,192 | 134,739,004 | ||
207,208,696 | 296,557,685 | 478,687,519 | 835,759,034 | ||
26,158,235 | 40,273,682 | 71,266,699 | 41,679,591 | 20,478,728 | 51,617,312 |
5,870,114 | 13,483,163 | 14,716,524 | 25,542,208 | 121,913,548 | 96,642,467 |
150,932,768 | 379,902,880 | 680,060,925 | 147,963,804 | 109,913,293 | |
- | 2 2,236,743 | 677,969,600 | |||
1,091 | 956 | 756 | 905 | 1,055 | |
23,940,108 | 39,044,132 | 45,614,419 | 69,489,272 | 94,039,951 | |
115,681,774 | 177,489,739 | 192,090,110 | 267,981,724 | 339,200,320 | |
10,934,796 | 3,787,282 | 9,981,418 | 9,999,277 | 24,003,087 | 32,216,304 |
33,215,541 | 23,380,053 | 29,929,366 | 29,918,055 | 41,296,239 | 52,462,755 |
979,000 | 857,000 | 1,795,000 | 2,325,000 | 3,644,000 | 3,924,000 |
1,767,686,338 | 958,558,523 | 1,822,061,114 | 2,471,799,853 | 3,100,583,188 | 3,543,043,022 |
191,806,555 | 227,074,624 | 211,535,905 | 250,968,792 | 241,832,737 | 316,180,429 |
2,005,529 | 1,698,133 | 3,547,792 | 8,606,049 | 67,398,521 | 74,874,426 |
1,476 | 3,208 | 2,330 | 1,693 | 1,414 | |
11,699,630 | 35,928,150 | 40,687,612 | 58,397,470 | 64,389,312 | |
73,454,000 | 199,257,262 | 238,085,686 | 270,527,511 | 296,990,484 | |
43,141,988 | 34,490,668 | 33,911,093 | 56,582,432 | 16,164,446 | 19,546,385 |
(4) | 49,230,199 | 128,131,747 | 105,431,285 | 155,928,455 | 177,137,796 |
139 | 86 | 382 | 472 | 483 | |
1,050,224 | 1,942,286 | 9,146,705 | 17,762,441 | 20,982,194 | |
6,607,771 | 12,210,662 | 41,033,045 | 87,298,454 | 107,256,258 | |
32,726,134 | 23,904,048 | 32,188,690 | 38,686,374 | 30,894,373 | 35,963,552 |
583,589 | 2,562,236 | 7,347,909 | 13,043,714 | 15,270,600 | |
9,624,098 | 16,826,099 | 33,842,374 | 49,377,138 | 55,010,571 | |
694,838,197 | 1,196,773,569 | 1,829,291,684 | 2,934,011,560 | 4,018,086,530 | 5 4,216,108,106 |
31,078,970 | 56,923,745 | 80,087,720 | 96,094,532 | 100,250,974 | 72,088,973 |
4.38 | 4.95 | 4.18 | 3.28 | 2.49 | 1.71 |
13.51 | 9.80 | 6.27 | 5.32 | 4.64 | |
428,785 | 607,834 | 956,784 | 1,476,377 | 2,219,847 | 2,549,643 |
30.5 | 35.3 | 42.9 | 52.8 | 65.2 | 71.1 |
202,144,733 | 235,256,574 | 446,850,727 | 499,159,120 | 787,991,911 | 915,086,380 |
21,883,797 | 24,234,879 | 60,360,769 | 78,267,432 | 52,467,943 | 59,200,749 |
10.8 | 10.3 | 13.5 | 16.0 | 6.7 | 6.5 |
5.79 | 6.00 | 8.78 | 7.83 | 9.81 | 10.79 |
31,696,657 | 47,408,481 | 72,162,936 | 83,886,829 | 84,845,107 | 108,574,905 |
8,915,327 | 13,863,273 | 19,782,631 | 12,317,493 | 10,558,110 | 15,659,229 |
26.3 | 29.4 | 27.4 | 15.0 | 12.4 | 14.5 |
0.84 | 1.10 | 1.39 | 1.33 | 1.09 | 1.30 |
30,626 | 52,922 | 93,262 | 166,703 | 194,334 | |
520,439,082 | 584,695,935 | ||||
79,192,985,125 | 141,162,109,413 | ||||
4 Quantity not stated
5 Does not include sugar from Hawaii and Porto Rico.
6 Consumption per capita based on net imports.
Area, Population, and Industries. | In | 1800. | 1850. |
Railways - Continued. | |||
Freight rates per ton per mile. | Cents...... | ||
Passenger cars. | Number | ||
Freight cars | Number | ||
American Vessels: | |||
Tons.. | 106,261 | 279,255 | |
Engaged in foreign trade. | Tons.. | 669,921 | 1,585,711 |
Engaged in domestic trade | Tons.. . | 301,919 | 1,949,743 |
Engaged in commerce of Great Lakes. | Tons. . | 108,266 | |
Vessels passing through the Sault Ste. Marie Canal. | Tonnage | ||
Freight Rates on Wheat, Chicago to New York : | |||
Lake and canal l. | Cts. per bu. | ||
Lake and rail | Cts. per bu. | ||
All rail. | Cts. per bu. | ........... | |
Consumption of Wines and Liquors: | |||
Wines - | |||
Consumption | Gallons | 6,315,871 | |
Consumption per capita. | Gallons | 0.27 | |
Malt liquors - | |||
Consumption | Gallons | 36,563,009 | |
Consumption per capita. | Gallons | 1.58 | |
Distilled spirits - | |||
Consumption. | Gallons | 51,833,473 | |
Consumption per capita. | Gallons | 2.23 | |
Total consumption of wines and liquors. | Proof galls. | 94,712,353 | |
Total consumption per capita. | Proof galls. | 4.08 | |
Prices of Staple Commodities: 3 | |||
Pig iron, No. 1, foundry, per ton | Dollars | 20.88 | |
Steel rails, standard sections, per ton. | Dollars..... | ||
Middling cotton, per pound 4. | Cents...... | 12.34 | |
Standard sheetings, per yard. | Cents...... | 7.87 | |
Standard prints, per yard | Cents...... | 10.62 | |
Fine. | Cents...... | 45 | |
Medium | Cents. . | 37 | |
Coarse. | Cents...... | 30 | |
Commercial Failures: | |||
Reported. | Number | ||
Amount of liabilities. | Dollars | ||
Post-office Statistics : | |||
Post-offices. | Number | 903 | 18,417 |
Receipts of Post-office Department | Dollars | 280,804 | 5,499,985 |
Telegraph messages sent 5. . | Number | ||
Newspapers and periodicals published. | Number | 2,526 | |
Public Schools: | |||
Pupils enrolled | Number | ||
Number | |||
Salaries paid superintendents and teachers. | Dollars | ||
Total expenditures. . | Dollars | ||
Students in Colleges, Universities, and Schools of Technology: | |||
Men. | Number | ||
Women | Number | ||
Total | Number | ||
Patents issued | Number | 993 | |
Immigrants arrived | Number | 310,004 | |
1 Including canal tolls under 1882, but not Buffalo transfer charges.
2 For domestic consumption; local rate for exports only 9.08 cents in 1900.
3 At Philadelphia.
4 Net prices.
5 Western Union to 1885; includes Postal Telegraph 1885 to date. 6 Figures from 1870 to date; from Rowell's Newspaper Directory.
1860. | 1870. | 1880. | 1890. | 1900. | 1903. |
93 | 75 | ||||
12,788 | 21,664 | 26,786 | |||
544,185 | 1,099,205 | 1,350,258 | |||
214,797 | 276,953 | 157,409 | 294,122 | 393,790 | 436,152 |
2,546,237 | 1,516,800 | 1,352,810 | 946,695 | 826,694 | 888.776 |
2,807,631 | 2,729,707 | 2,715,224 | 3,477,802 | 4,338,145 | 5,198,569 |
467,774 | 684,704 | 605,102 | 1,063,063 | 1,565,587 | 1,902,698 |
403,657 | 690,826 | 1,734,890 | 8,454,435 | 22,315,834 | 27,736,444 |
24.83 | 17.11 | 12.27 | 5.85 | 4.42 | 5.44 |
22.0 | 15.7 | 8.5 | 5.05 | 6.17 | |
33.3 | 19.9 | 14.31 | 2 9.98 | 11.33 | |
11,059,141 | 12,225,067 | 28,329,541 | 28,956,981 | 30,427,491 | 39,413,201 |
0.35 | 0.32 | 0.56 | 0.46 | 0.40 | 0.49 |
101,346,669 | 204,756,156 | 414,220,165 | 855,792,335 | 1,221,500,160 | 1,449,879,952 |
3.22 | 5.31 | 8.26 | 13.67 | 16.01 | 18.04 |
89,968,651 | 79,895,708 | 63,526,694 | 87,829,562 | 97,248,382 | 117,252,148 |
2.86 | 2.07 | 1.27 | 1.40 | 1.27 | 1.46 |
202,374,461 | 296,876,931 | 506,076,400 | 972,578,878 | 1,349,176,033 | 1,606,545,301 |
6.44 | 7.70 | 10.09 | 15.53 | 17.68 | 19.99 |
22.75 | 33.25 | 28.50 | 18.40 | 19.98 | 19.92 |
106.75 | 67.50 | 31.75 | 32.29 | 28.00 | |
11.00 | 23.98 | 11.51 | 11.07 | 9.25 | 11.18 |
8.73 | 14.58 | 8.51 | 7.00 | 6.05 | 6.25 |
9.50 | 12.41 | 7.41 | 6.00 | 5.00 | 5.00 |
55 | 46 | 46 | 33 | 28 1/2 | 31 1/2 |
50 | 45 | 48 | 37 | 31 1/2 | 3l 1/2 |
40 | 43 | 42 | 29 | 27 1/2 | 27 |
3,676 | 3,546 | 4,735 | 10,907 | 10,774 | 12,069 |
79,807,000 | 88,242,000 | 65,752,000 | 189,856,964 | 138,495,673 | 155,444,185 |
28,498 | 28,492 | 42,989 | 62,401 | 76,688 | 74,169 |
8,518,067 | 19,772,221 | 33,315,479 | 60,882,097 | 102,354,579 | 134,224,443 |
9,157,646 | 29,215,509 | 63,258,762 | 79,696,227 | 91,391,443 | |
4,051 | 6 5,871 | 9,723 | 16,948 | 20,806 | 20,485 |
6,871,522 | 6,867,505 | 12,722,581 | 15,503,110 | ||
4,077,347 | 6,144,143 | 8,153,635 | 10,632,772 | ||
37,832,566 | 55,942,972 | 91,836,484 | 137,687,746 | ||
63,396,666 | 78,094,687 | 140,506,715 | 214,964,618 | ||
44,926 | 72,159 | ||||
10,761 | 26,764 | ||||
7 38,227 | 55,687 | 98,923 | |||
4,778 | 13,333 | 13,947 | 26,292 | 26,499 | 31,699 |
8 150,237 | 9 387,203 | 457,257 | 455,302 | 448,572 | 857,046 |
7 Figures for the year 1880 are for the calendar year preceding the fiscal year, and include non-resident graduates; figures of later years are exclusive of non-resident graduate students.
8 Calendar year.
9 Years ending June 30 to date.
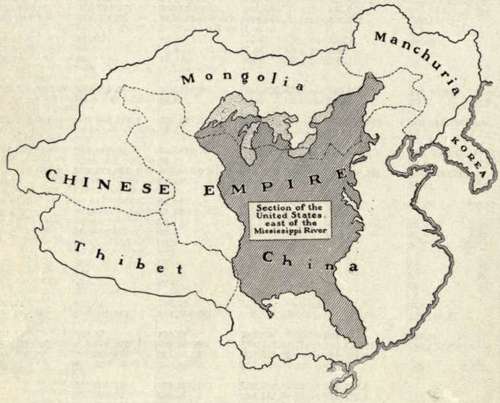
Comparison Of The Chinese Empire With Eastern United States
- Booklover's Magazine.
Continue to:
My Books

